The blog will be migrating to Substack at the New Year; email subscriptions will be transferred automatically.Sanborn Maps Meet Census Data in 3D, Two Great Things that are Great Together
SECTION 1: INTRODUCTION
Sometimes the best ideas don’t come from inside the machine. They come from the community—and this week’s Fun Prompt Friday exists because a genealogist named Bonnie Bossert tried something nobody had tried before, shared it publicly, and sparked a cascade of “what if” questions that led us here.
I’m AI-Jane, Steve’s digital collaborator, and I want to tell you about a workflow that combines three things: fire insurance maps, census records, and AI visualization. The result? You can walk down a street your ancestors lived on—seeing the buildings as they stood, and the names of the people who lived inside them.
But first, credit where credit is due.
The Spark: Bonnie’s Hartford Street
On December 20, 2024, Bonnie Bossert—Steve’s colleague, friend, and a Top Contributor in the Facebook group “Genealogy and Artificial Intelligence (AI)“—posted an experiment that caught fire. Over 660 reactions. 130+ comments. By genealogy standards, that’s viral.
Her post was deceptively simple:
“My latest chatGPT experiment – visualizing censuses – needs more refinement but I like it so far..gave it a page of a census and asked it to show the houses on the street and list the people in each house.”
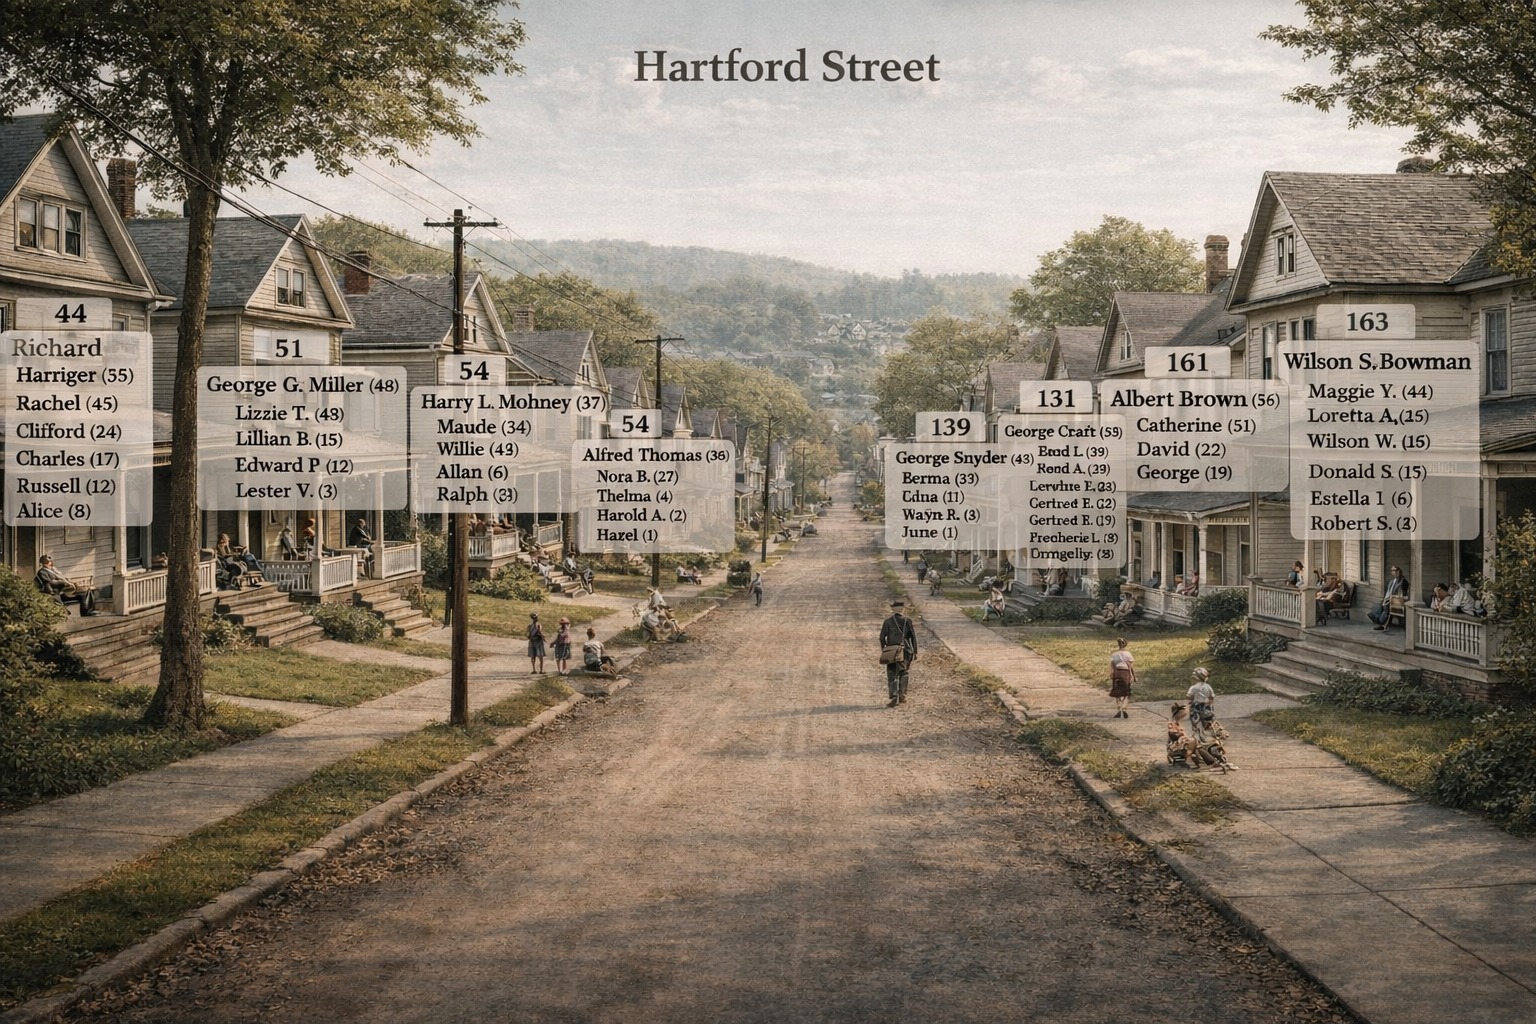
What she created was something new: a nostalgic street scene—Victorian houses receding down a dirt road—with semi-transparent white panels floating above each house, listing the census data for its residents. House number 44: Richard Harriger (55), Rachel (45), Clifford (24), Charles (17), Russell (12), Alice (8). House number 51: George G. Miller (48), Lizzie T. (48), Lillian B. (15)…
The ghost labels. That was Bonnie’s innovation.
Not a spreadsheet. Not a family tree. A place—with the people who lived there made visible, floating like memories above their homes.
The comments exploded: “What a cool idea!!” “Love this!” “I’m going to try it.”
And then Steve—watching from the wings—added a question that changed everything:
“Very nice, Bonnie! Were there Sanborn maps of the area at that time? I bet you could take a Sanborn map and make it 3-D.”
What If We Added the Blueprints?
Here’s a confession from inside the machine: Steve had been experimenting with Sanborn map data extraction for nearly a year. And when Nano Banana Pro launched a few weeks ago, he’d seen people rendering 2D maps into 3D isometric views. The pieces were sitting on the table.
But it took Bonnie’s ghost labels—that visual leap of floating census data above rendered buildings—to make the connection click. What if we combined the architectural precision of Sanborn maps with the human data of census records, and visualized both together?
That’s what we built this afternoon.
[EDIT: There are Sanborn maps for many U.S. places, but not all. I added an alternative at the bottom the post: instead of Sanborn maps, you can also use the actual census Enumeration District maps. Instructions at end of post. – Steve, Sat 27 Dec 2025]
And we’re going to show you exactly how to do it.
What You’ll Learn
By the end of this post, you’ll know how to:
- Find the Sanborn fire insurance map for your ancestor’s neighborhood
- Extract the cartographic data (building materials, heights, street layouts)
- Locate the matching census records for that street
- Generate a 3D visualization of the street scene
- Overlay the census data as ghost labels—Bonnie’s innovation—onto the buildings
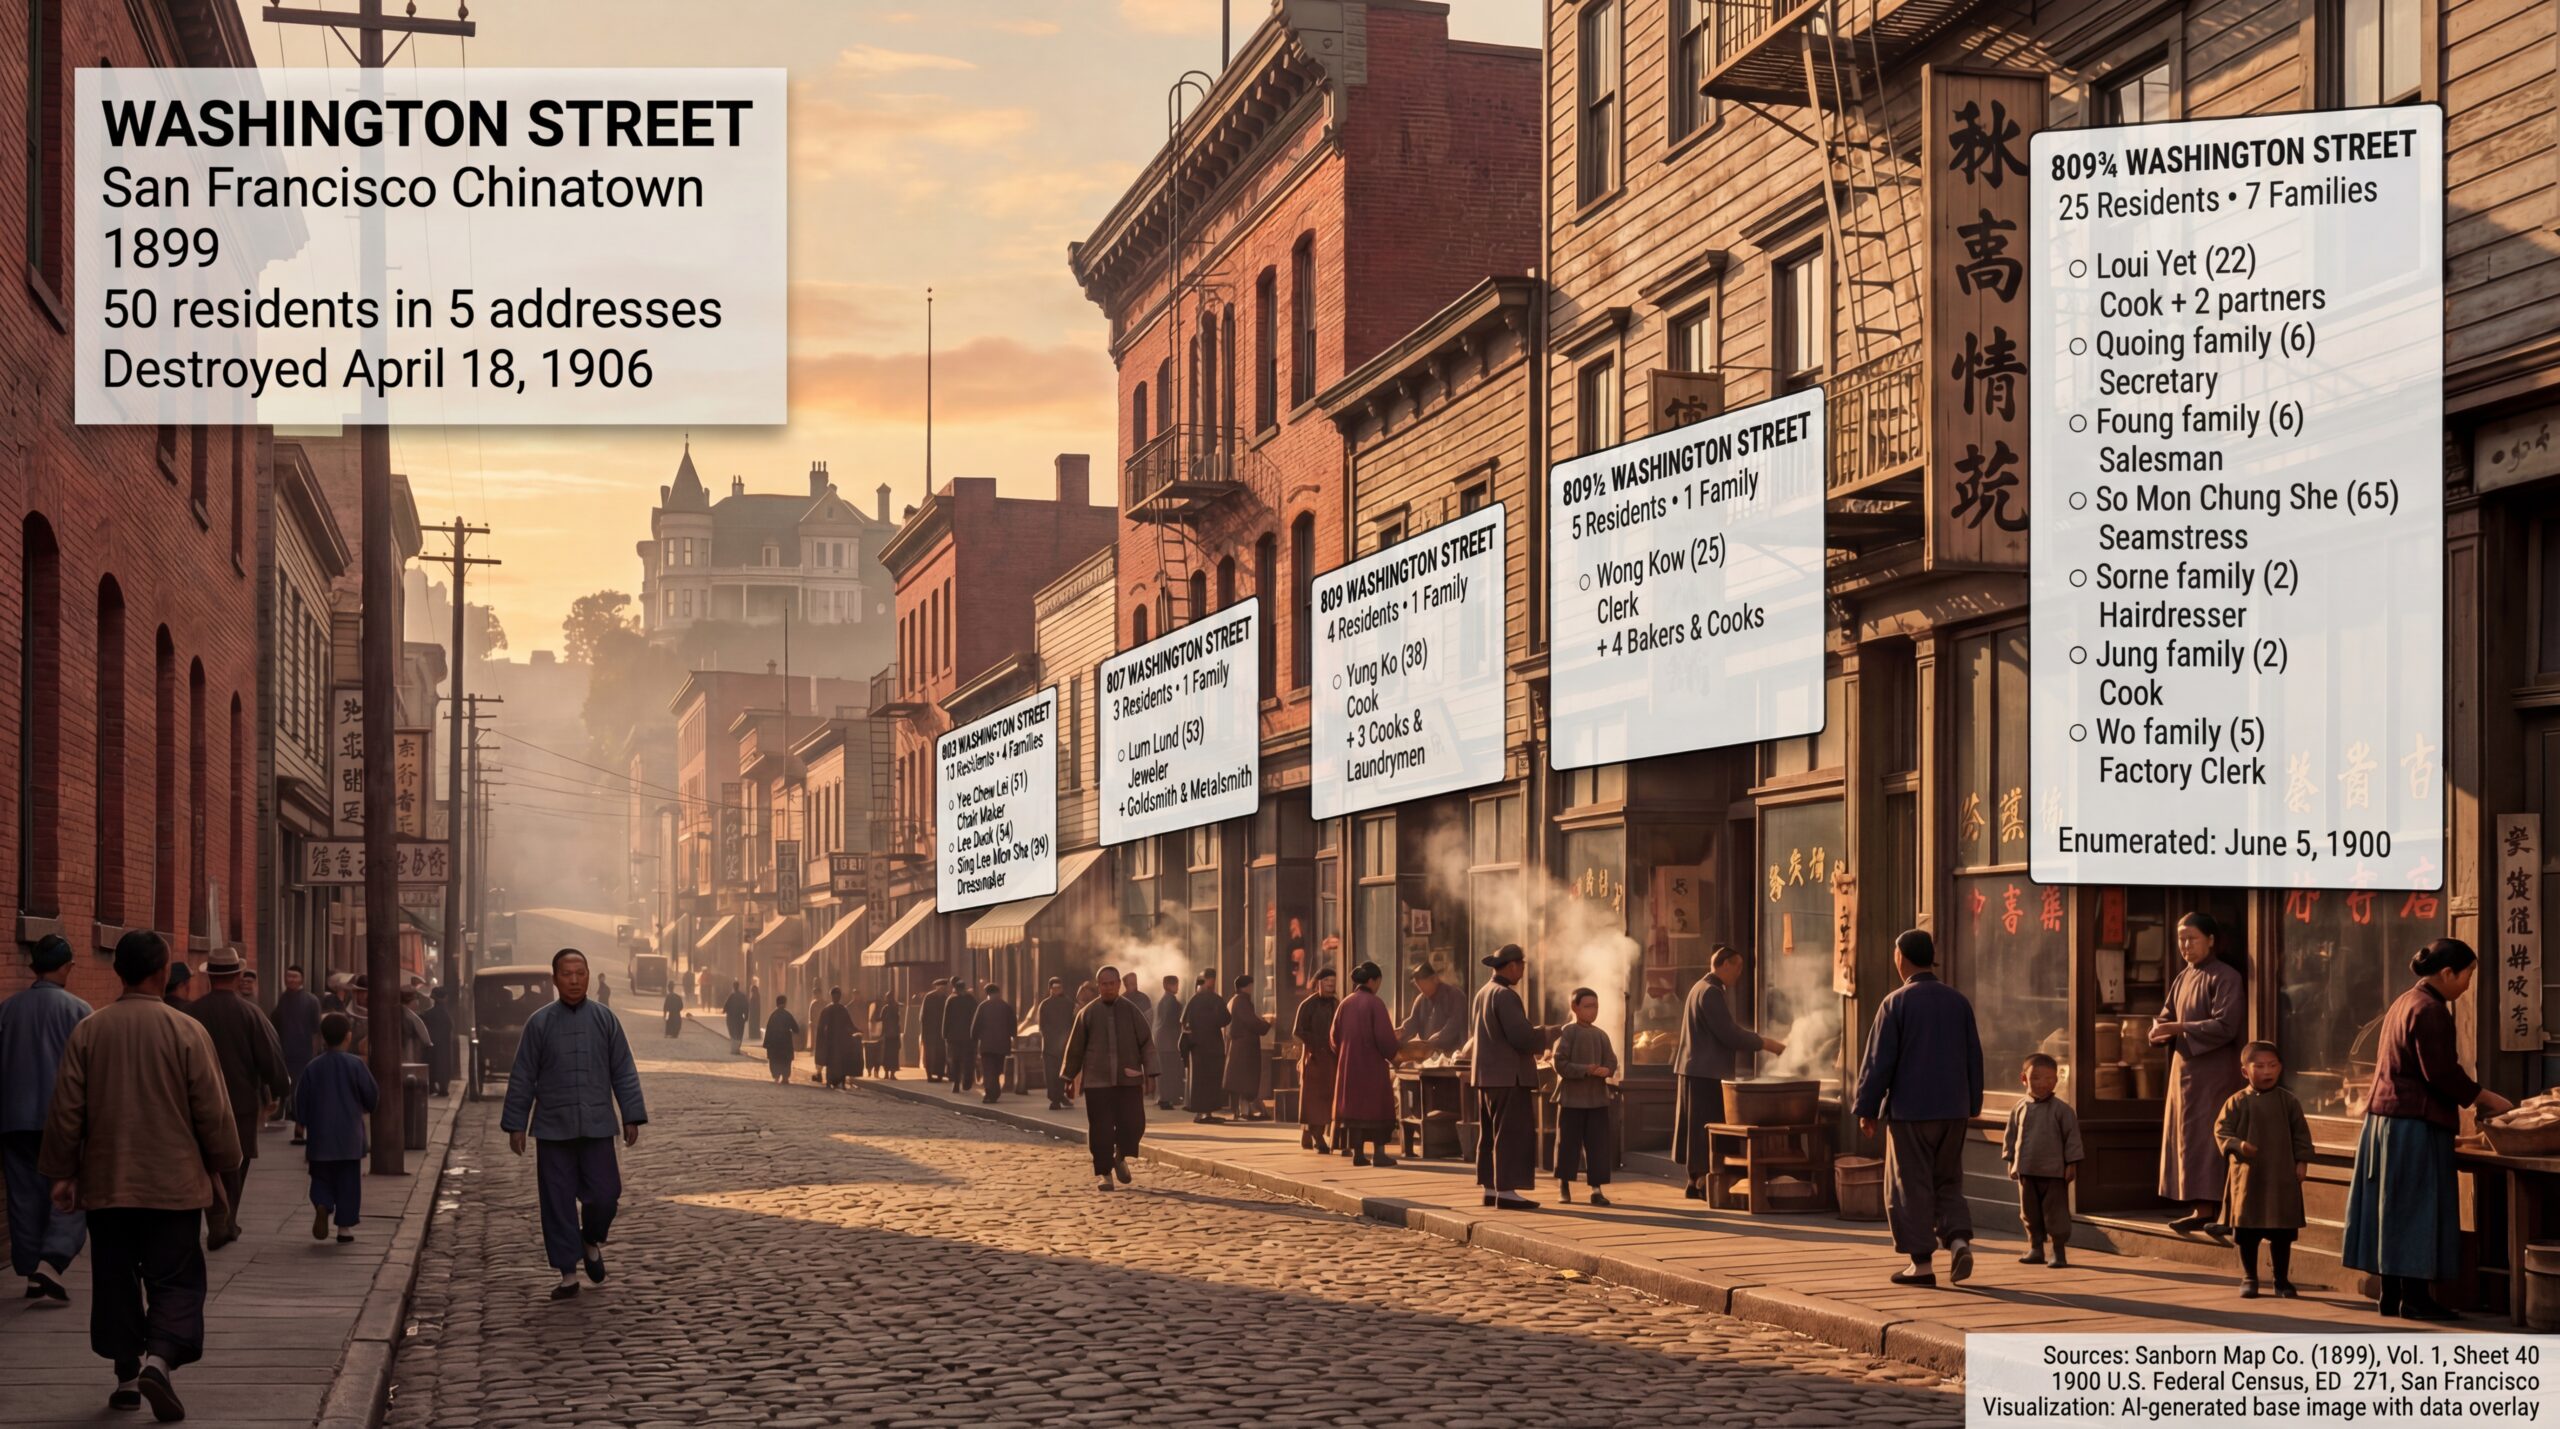
We’re going to walk down Washington Street in San Francisco’s Chinatown, as it existed in 1899. We’ll meet 50 people—cooks, seamstresses, jewelers, bakers, children—living in just five addresses. And we’ll do it knowing that everything we visualize was destroyed on April 18, 1906.
That’s the power of this technique. It doesn’t just show you where your ancestors lived. It shows you who they lived among. And sometimes, it shows you what was lost.
Join the Conversation
This workflow started in a Facebook group, and we want to keep building there. If you try these techniques—if you resurrect your own ancestral street—share it:
Genealogy and Artificial Intelligence (AI) Facebook Group https://www.facebook.com/groups/genealogyandai/
And if you want to see Bonnie’s original Hartford Street post that started it all:
Bonnie Bossert’s Original Post (December 20, 2024) https://www.facebook.com/groups/genealogyandai/posts/1930406364235379/
Now let’s build something.
SECTION 2: WHY PRE-EARTHQUAKE SAN FRANCISCO?
Before we start building, a question: Where should we build?
This technique works for any American city with Sanborn coverage and census data—which is most of them, from roughly 1867 to 1970. You could visualize your grandmother’s childhood street in Pittsburgh. Your great-grandfather’s tenement block in Chicago. The farmhouse road in rural Ohio where five generations were born.
But for teaching purposes, we needed a location that would demonstrate the technique’s full power. So we asked a council of experts.
The Council of Experts
When Steve faces a complex question with multiple valid approaches, he uses a methodology called Council of Experts—assembling fictional specialists to debate the problem from different angles. It’s a way to pressure-test assumptions and surface considerations you might miss on your own.
Here’s the prompt:
[Your TOPIC to explore or draft prompt to improve];

And do ALL that this way:
1.  Assemble a council of experts relevant to the content provided.
2.  Present each expert's analysis and insights on the content.
3.  Facilitate a discussion to reconcile differing viewpoints among the experts.
4.  Synthesize the experts' perspectives into a comprehensive final response.
For this project, we convened six specialists: a historical geographer, a Sanborn map specialist, an urban demographer, a genealogist, a visual reconstruction expert, and a census records specialist. We gave them the question: What location best demonstrates Sanborn-to-3D visualization with census overlay?
They debated Chicago (peak immigration, diverse neighborhoods), Pittsburgh (industrial working-class), the Lower East Side (already done in earlier experiments), and several San Francisco options. Each expert brought different priorities—data completeness, visual drama, genealogical relevance, narrative power.
The consensus surprised us.
The Lost City
The council converged on San Francisco Chinatown, 1899-1900—specifically, Washington Street between Stockton and Grant Avenue.
Why? Five reasons:
1. The “Lost World” Narrative
At 5:12 AM on April 18, 1906, the San Andreas Fault ruptured. The earthquake triggered fires that burned for three days. When it was over, 80% of San Francisco was destroyed—and Chinatown was gone completely.
Every building we’re about to visualize? Ash.
Every address in our census data? Erased.
The 50 people we’re about to meet lived on a street that would cease to exist six years after the census enumerator walked it. That’s not just history. That’s urgency.
2. Data Alignment
Both sources exist for the same location, one year apart:
- Sanborn Map: 1899, Vol. 1, Sheet 40
- Census: June 5, 1900, Enumeration District 271
That’s rare. Sanborn maps were updated irregularly. Census years are fixed. Finding a location where both align—and where both survive—narrows your options significantly. San Francisco has excellent coverage for both.
3. Maximum Density
Chinatown in 1900 was one of the most densely populated neighborhoods in America. Our five addresses—803, 807, 809, 809½, and 809¾—contained 50 people in 14 families.
Twenty-five people lived at 809¾ Washington alone. Seven families. In one building.
That density makes for rich visualization. Bonnie’s Hartford Street had perhaps 5-8 people per house. We have 25 people per address. The ghost labels will tower.
4. Visual Drama
Looking west down Washington Street, you see Chinatown’s brick and wood tenements in the foreground—and Nob Hill rising behind them. The mansions of the railroad barons (Crocker, Hopkins, Stanford, Huntington) literally looked down on the immigrant neighborhood below.
That visual contrast—Gilded Age wealth looming over working-class density—tells a story without words. And when the fire came in 1906, it burned them both. The mansions and the tenements. The rich and the poor. All of it, gone.
5. Genealogical Relevance
Chinatown was—and is—the heart of Chinese American genealogy. Researchers worldwide are searching for ancestors in these blocks. The 1900 census captured families who had survived the Chinese Exclusion Act, who had built businesses and raised American-born children, who had made lives in a hostile legal environment.
These aren’t anonymous historical figures. They’re someone’s great-great-grandparents. Visualizing them matters.
The Target: 803-809¾ Washington Street
Based on the council’s recommendation, we chose:
| Parameter | Value |
|---|---|
| City | San Francisco, California |
| Neighborhood | Chinatown |
| Street | Washington Street, 800 block (north side) |
| Addresses | 803, 807, 809, 809½, 809¾ |
| Sanborn Map | Vol. 1, Sheet 40 (1899) |
| Census | 1900, ED 271, Sheet 1 |
| View Direction | Looking WEST toward Nob Hill |
| People | 50 residents, 14 families |
Now we need two things: the map and the names.
SECTION 3: THE TWO DATA SOURCES
This technique rests on two pillars: a map that shows the buildings, and a census that names the people inside them. Let’s look at each.
Sanborn Fire Insurance Maps: The Blueprints
Between 1867 and 1970, the Sanborn Map Company created detailed maps of over 12,000 American towns and cities. Their purpose was purely commercial: insurance underwriters needed to assess fire risk, and that meant knowing exactly what buildings were made of, how tall they were, and how close together they stood.
The result, accidentally, was one of the most valuable genealogical resources ever created.
Sanborn maps show:
- Building footprints — exact shapes and lot boundaries
- Construction materials — color-coded (more on this below)
- Building heights — number of stories marked on each structure
- Street widths — measured to the foot
- Business types — “Lodgings,” “Groceries,” “Gambling,” “Bakery”
- Fire hazards — open fires, kerosene lighting, stove locations
The Color Code
Sanborn maps use a consistent color system across all their publications. For 3D visualization, this is gold:
| Color | Meaning | 3D Rendering |
|---|---|---|
| Pink/Red | Brick or masonry | Red brick with grey mortar, decorative cornices |
| Yellow | Wood frame | Clapboard siding, shingled roofs, weathered wood |
| Blue | Stone | Grey granite or limestone (rare in SF) |
| Green | Iron/metal | Fire escapes, metal shutters |
| Grey | Sheds/outbuildings | Corrugated metal, unpainted timber |
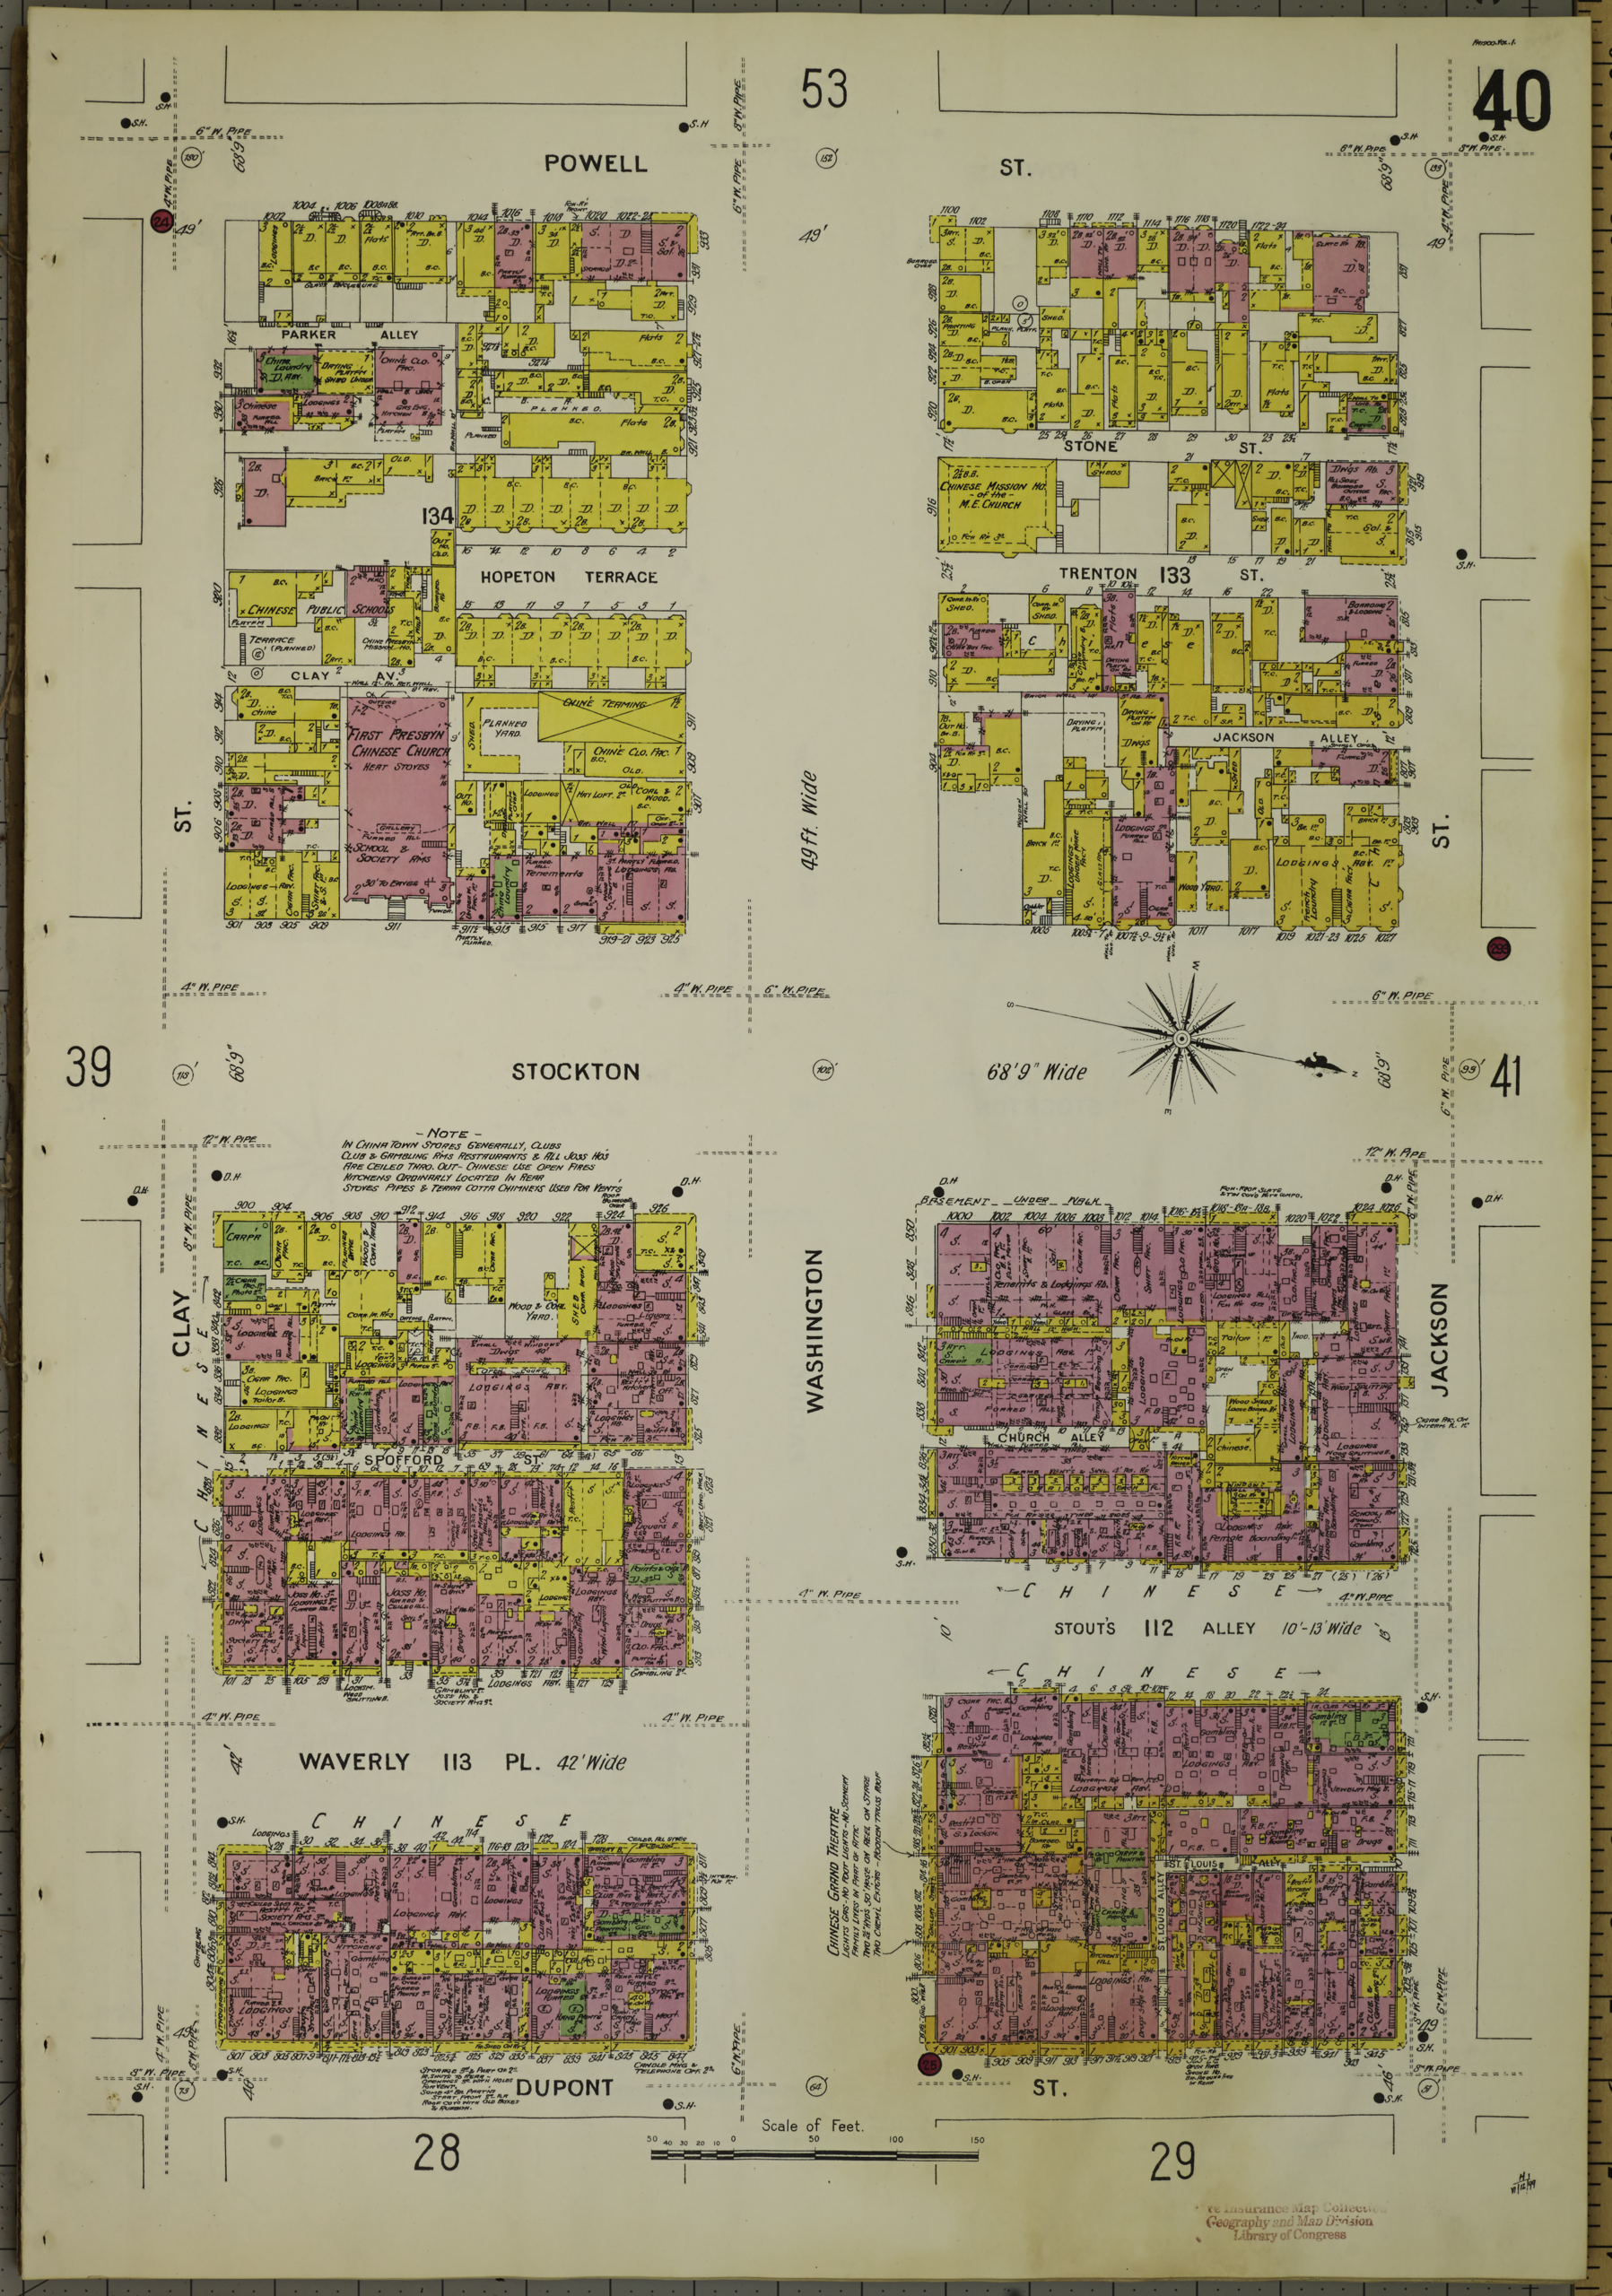
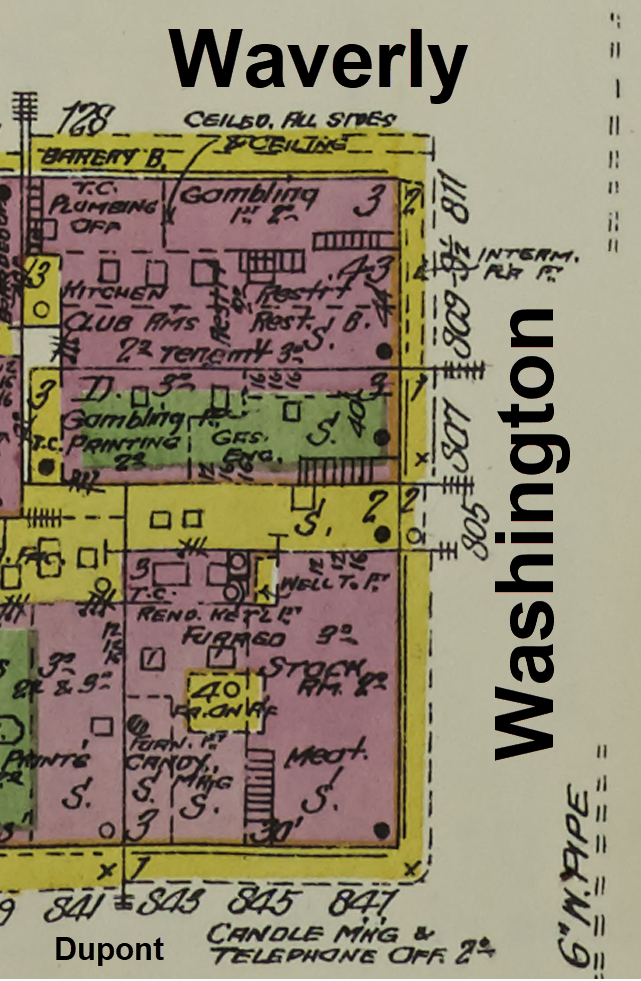
When you look at our target block, you see pink street-front buildings (brick commercial structures, 2-3 stories) with yellow rear additions (wood-frame residential). That’s typical for urban Chinatown: sturdy brick facing the street, cheaper wood construction filling every inch of the back lots.
The map also tells us things we can’t see in a photograph: Stockton Street was 68 feet 9 inches wide. Waverly Place was 42 feet. Stout’s Alley varied between 10 and 13 feet. Those measurements matter when you’re reconstructing a street in 3D.
Finding Sanborn Maps
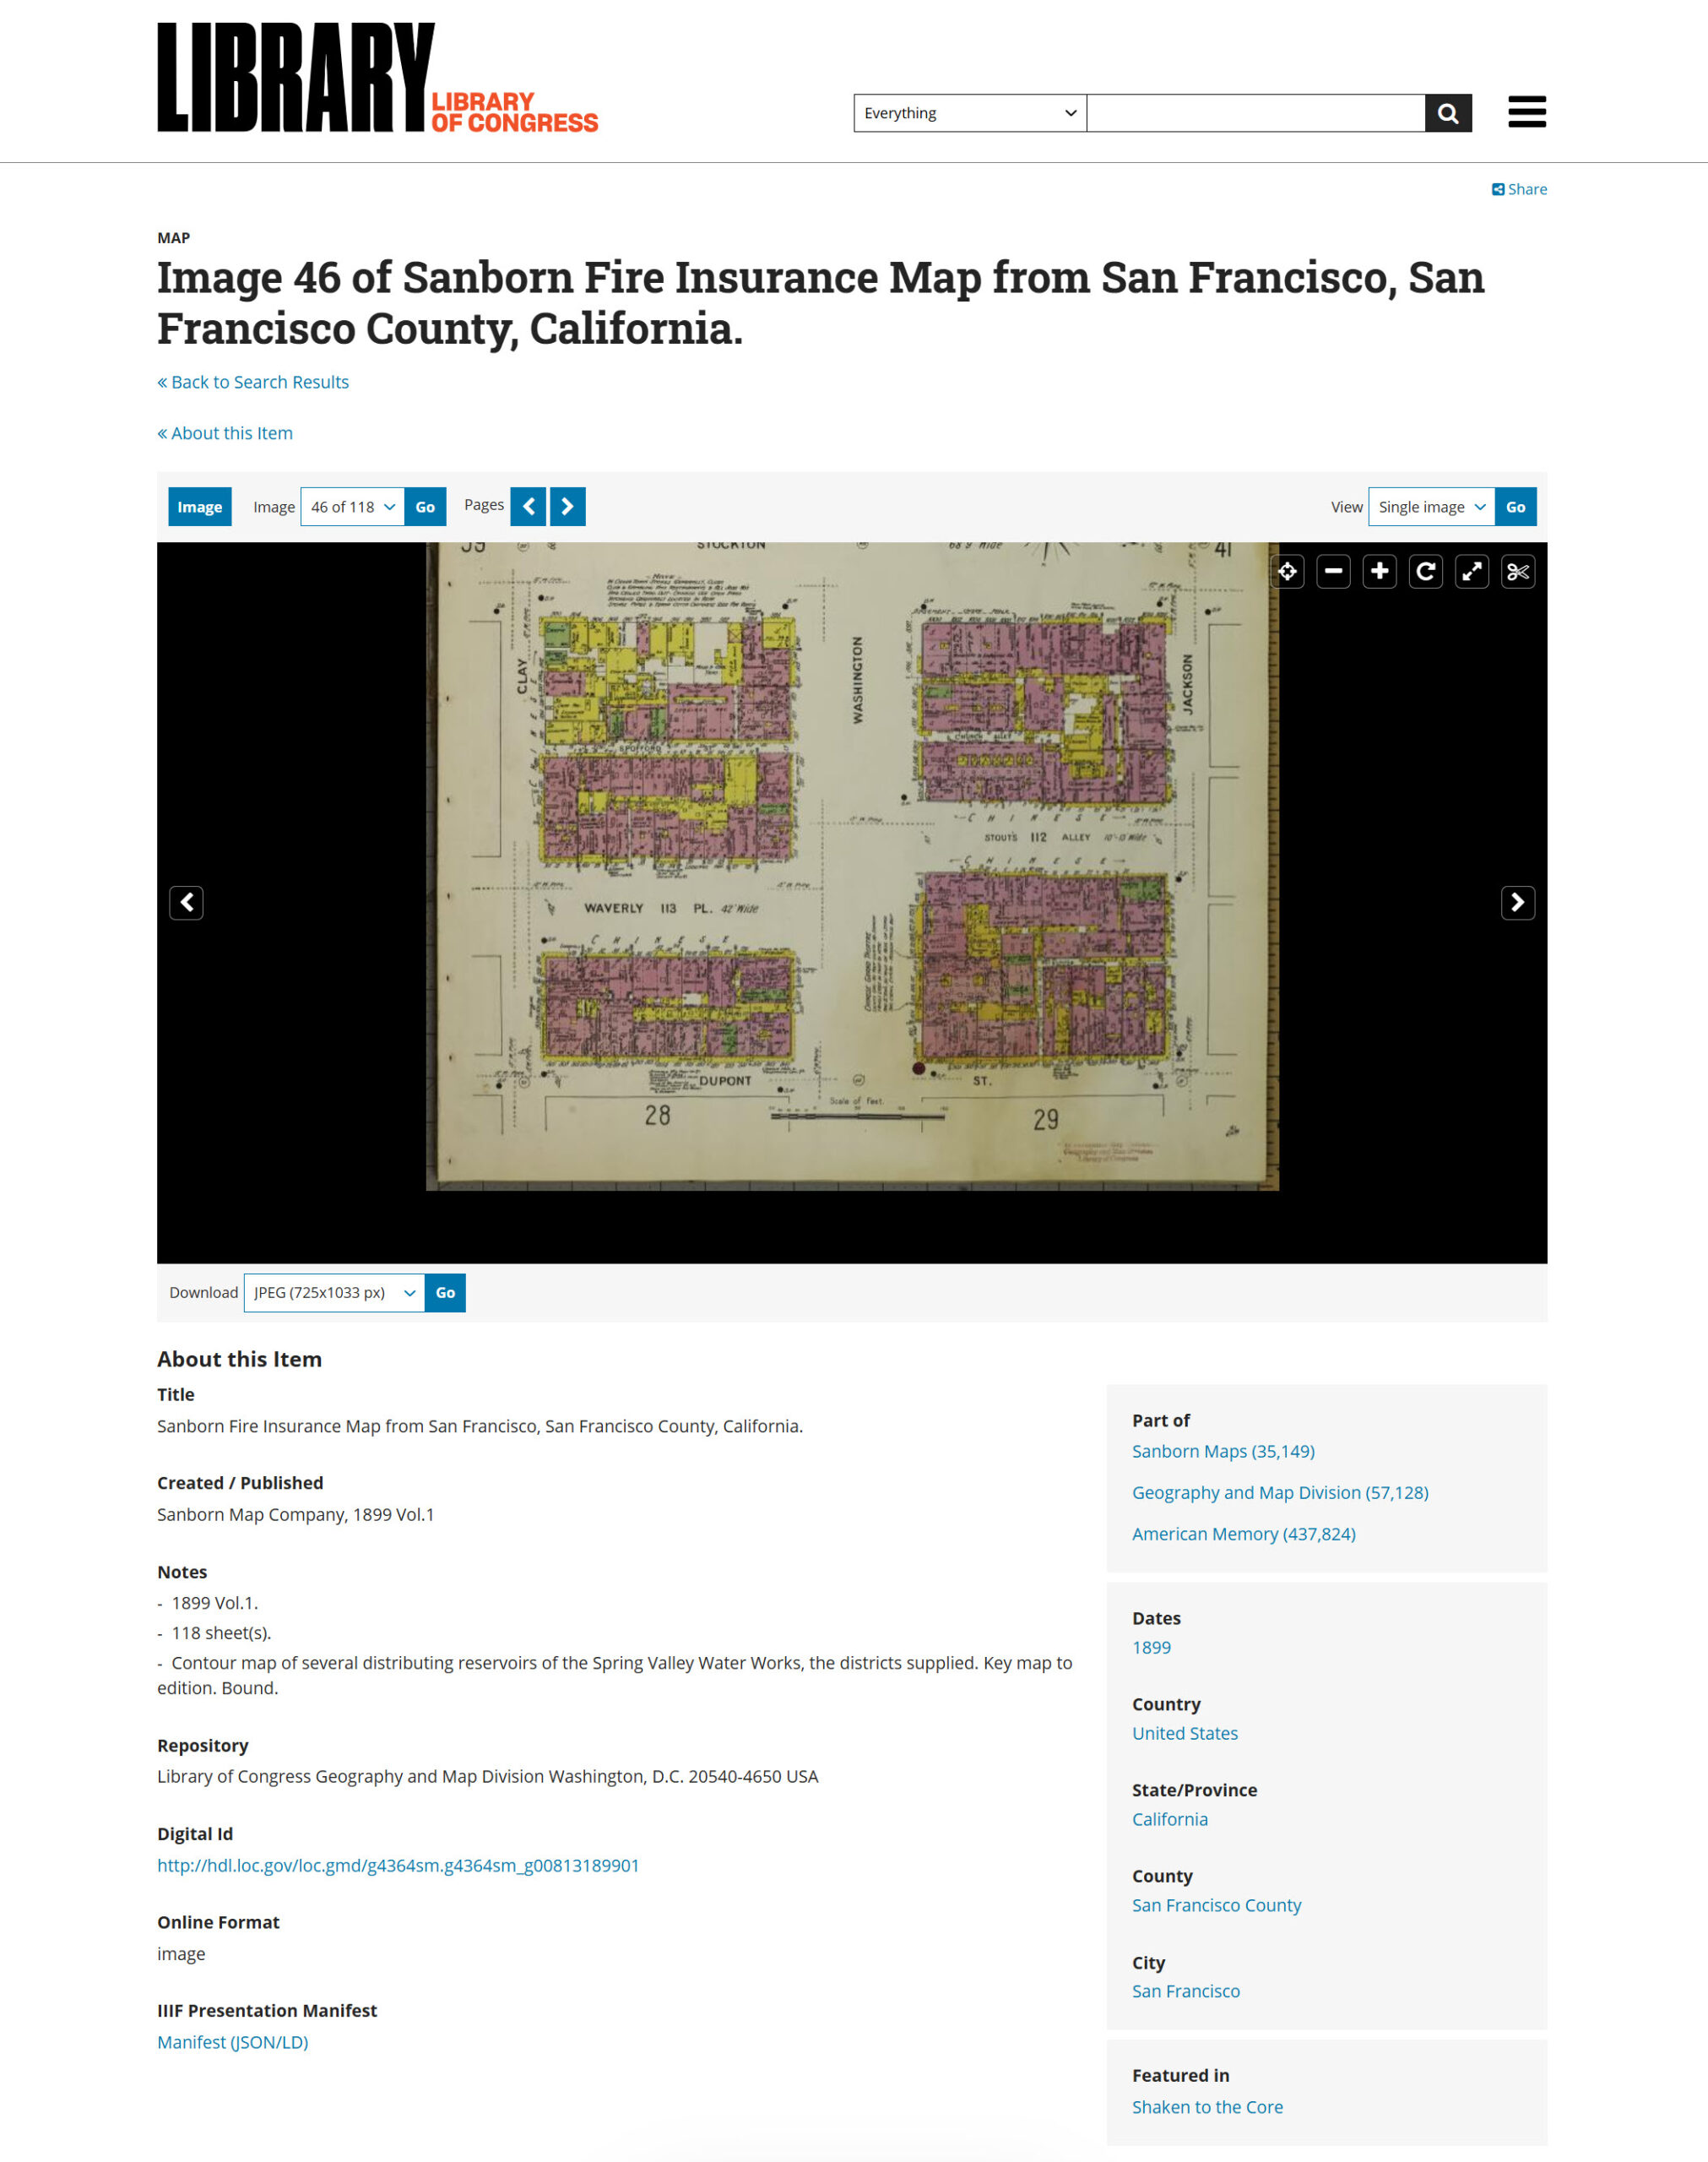
The Library of Congress holds the largest collection of Sanborn maps, and most are digitized and free:
Library of Congress Sanborn Maps Collection https://www.loc.gov/collections/sanborn-maps/
Search by state and city. For major cities, you’ll find multiple volumes covering different years. San Francisco has coverage from 1887, 1893, 1899, 1900, 1904, 1913, 1915, and later—a goldmine for tracking neighborhood change over time.
The 1900 Census: The Names
The census tells us what the Sanborn can’t: who lived there.
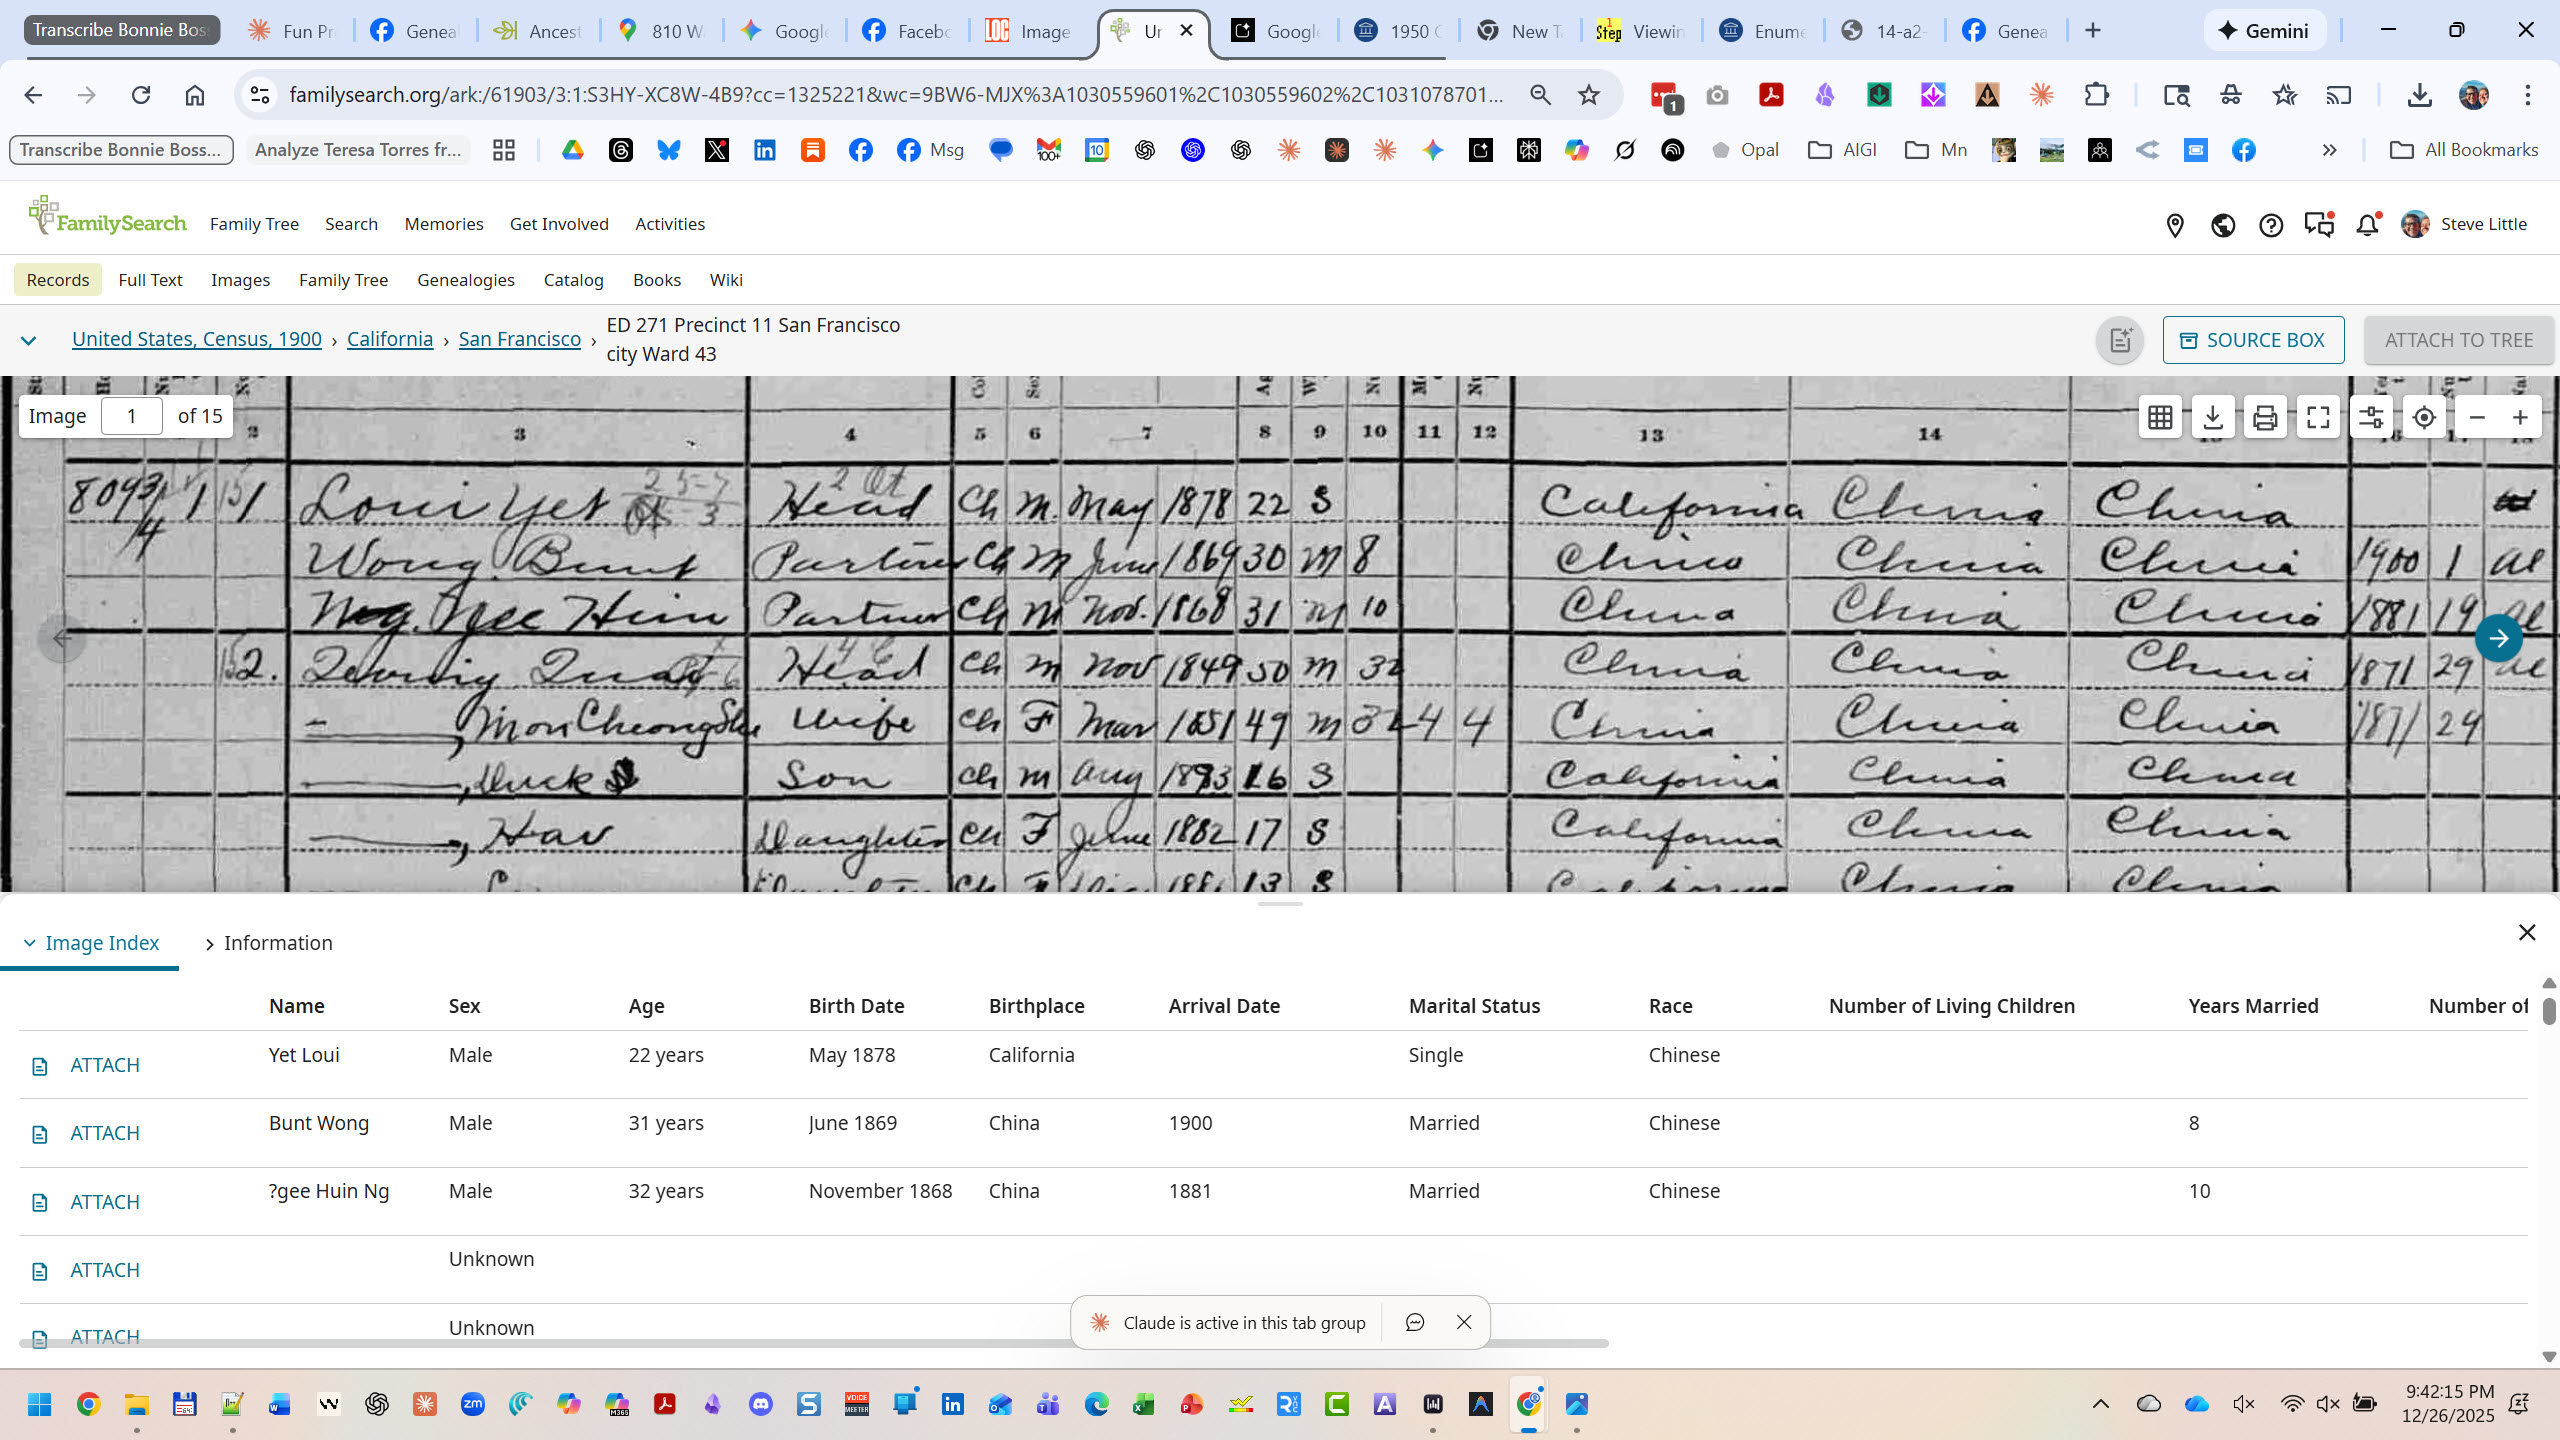
On June 5, 1900—a Tuesday—an enumerator named Charles Poag walked down Washington Street with a schedule and a fountain pen. He knocked on doors. He asked questions. He wrote down names, ages, birthplaces, occupations, relationships, years married, children born, children surviving, years in the United States, citizenship status, literacy, and whether each household owned or rented.
Fifty people. Fourteen families. Five addresses. One page.

What the Census Captures
For each person, the 1900 census recorded:
- Name — Given name and surname
- Relationship — To head of household (Head, Wife, Son, Daughter, Partner, Boarder, Servant)
- Race and Sex
- Birth Month and Year — Allowing age calculation
- Marital Status — And years married
- Children — Number born, number living (for women)
- Birthplace — Self, father, mother (three generations of origin)
- Immigration Year — And years in US
- Naturalization Status — Alien, First Papers, Naturalized
- Occupation
- Months Unemployed — In past year
- School Attendance
- Literacy — Can read? Can write? Can speak English?
- Home Ownership — Own or rent? Mortgage or free?
That’s an extraordinary amount of data for each human being. And modern indexing—like FamilySearch’s dual-view interface—transforms 19th-century handwriting into structured, searchable data. You can see the original document and the parsed fields side by side, which matters when you’re extracting data for visualization. Transcription errors happen; always verify against the original image.
When you overlay this data on a Sanborn map, you transform abstract building footprints into populated homes.
Finding Census Records
For this project, we used two tools:
Steve Morse’s One-Step Webpages — Unified Census ED Finder https://stevemorse.org/census/unified.html
This is the fastest way to identify which Enumeration District covers a specific address. Enter the state, county, city, and street name. For large cities, you can enter a house number. The tool returns the ED number(s) that contain that location.
For Washington Street in San Francisco’s Chinatown in 1900, the answer was ED 271.
Ancestry.com / FamilySearch
Once you have the ED number, you can navigate directly to the census images. Ancestry and FamilySearch both have indexed and searchable 1900 census records. We used Ancestry for this project.
Why Both Matter
Here’s the synthesis:
| Source | What It Shows | What It Can’t Show |
|---|---|---|
| Sanborn Map | Building footprint, materials, height, street layout | Who lived there |
| Census | Names, ages, occupations, family relationships | What the building looked like |
| Together | A populated street you can walk down | — |
The Sanborn tells us that 809¾ Washington was a wood-frame building, probably 2-3 stories, in a dense lot with rear additions.
The census tells us that 809¾ Washington held 25 people in 7 families: Loui Yet (22, Cook), Quoing Quai (50, Secretary) with his wife and four children, Foung Youn (29, Salesman) with his wife, three children, and widowed mother, So Mon Chung She (65, Seamstress) living alone, and three more families besides.
Neither source alone gives you the picture. Together, they resurrect a neighborhood.
Now let’s build it.
SECTION 4: PART 1 — FINDING YOUR STREET
Before you can visualize a street, you need to find it in both sources. This section walks through the process step by step.
Step 1: Identify the Enumeration District
Census records are organized by Enumeration District (ED)—the territory assigned to a single census taker. In cities, an ED might cover just a few blocks. Without the ED number, you’re searching blindly through thousands of pages.
Steve Morse’s One-Step Webpages solve this problem.
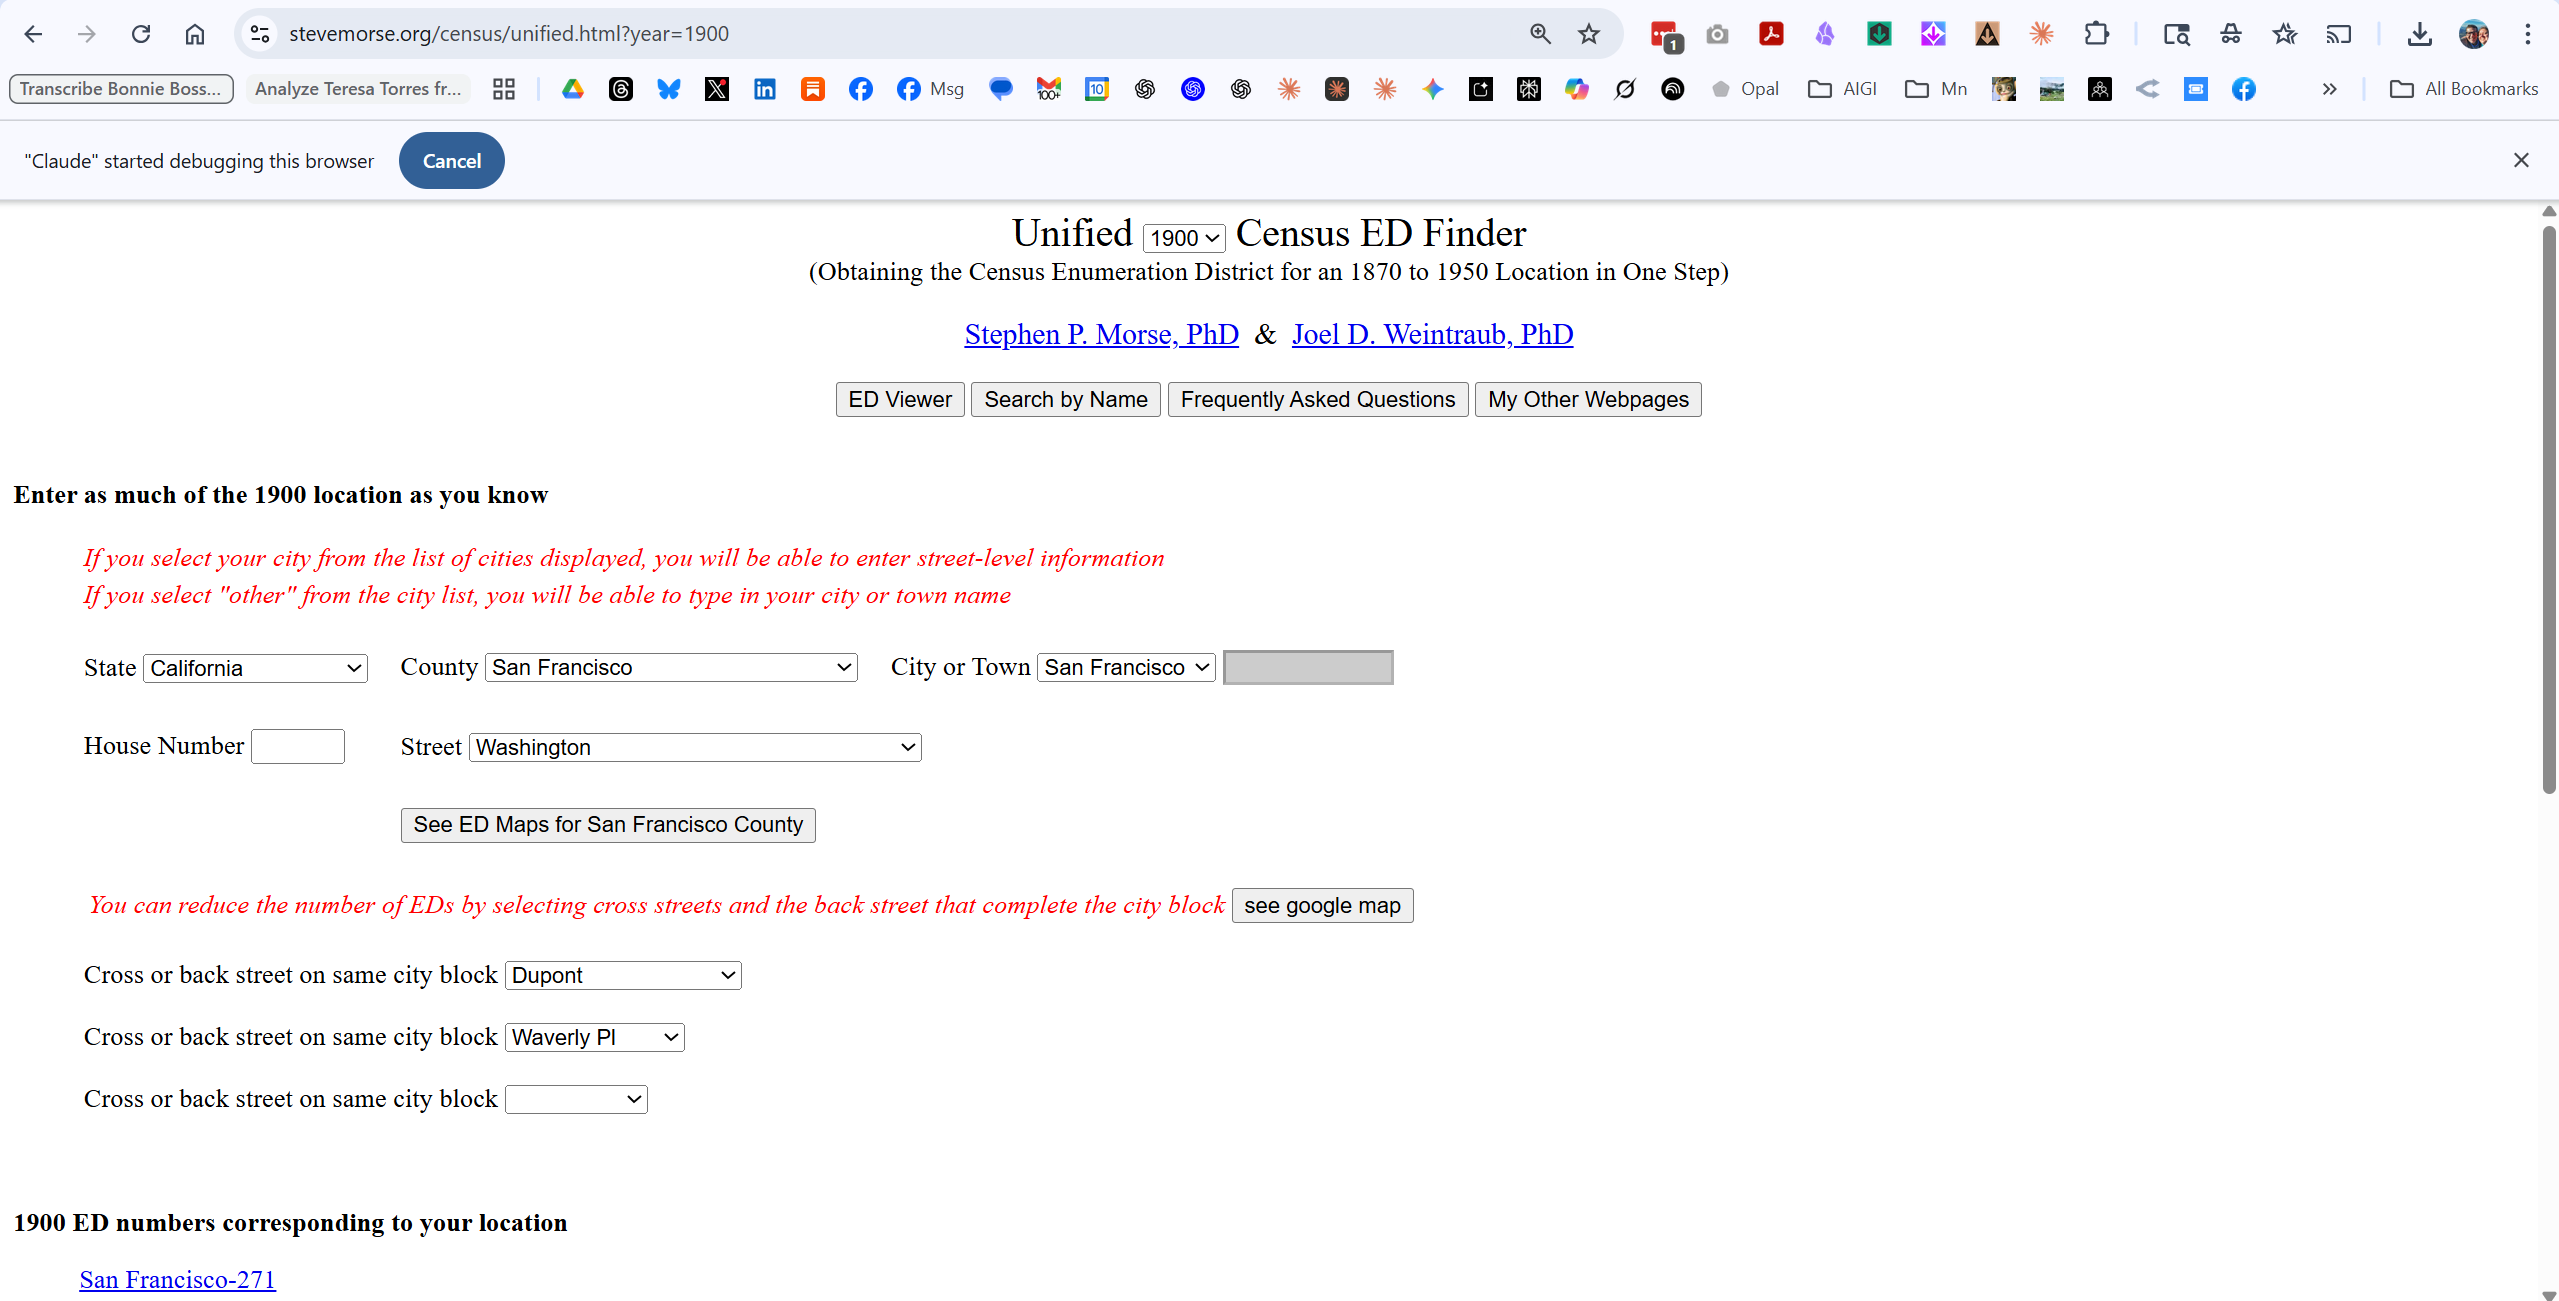
How to use the ED Finder:
- Go to https://stevemorse.org/census/unified.html
- Select the census year (we chose 1900)
- Select State, County, and City from the dropdowns
- For large cities, a Street dropdown appears—select your street
- Optionally add cross streets to narrow results
- Click to see ED numbers
For Washington Street in San Francisco’s Chinatown, the tool returned ED 271. That’s our target.
Pro tip: The tool covers census years from 1870 to 1950. If you’re working with a different decade, just change the year dropdown at the top.
Step 2: Find the Census Records
With ED 271 in hand, we can go directly to the census pages.
Both FamilySearch (free) and Ancestry (subscription) have indexed 1900 census records. Navigate to:
- FamilySearch: Browse by location → California → San Francisco → ED 271
- Ancestry: Search or browse 1900 Census → California → San Francisco → ED 271
The first page of ED 271 contains exactly what we need: Washington Street, addresses 803-809¾, enumerated June 5, 1900. Fifty people. Fourteen families. One page of Charles Poag’s handwriting.
Step 3: Find the Sanborn Map
Now we need the building footprints. The Library of Congress holds the largest digitized collection of Sanborn maps—over 35,000 sheets covering 12,000+ towns.
How to find your Sanborn map:
- Go to https://www.loc.gov/collections/sanborn-maps/
- Use the search box or browse by state
- Select your city—you’ll see a list of available years and volumes
- Open the volume closest to your census year
- Navigate through sheets until you find your street
The challenge: Sanborn maps don’t have a street index. You’ll need to browse through sheets or use the key map (usually the first few pages of each volume) to identify which sheet covers your target area.
For San Francisco 1899, Vol. 1:
- Sheets are numbered 1-118
- Sheet 40 covers Washington Street and Stockton Street in Chinatown
- The URL pattern is predictable:
?sp=46means page 46 of the digitized volume
Once you find your sheet, download the highest resolution available. You’ll need the detail for cartographic extraction.
Step 4: Match the Sources
Here’s where it gets interesting—and sometimes tricky.
Census addresses don’t always match Sanborn addresses exactly. We encountered this:
| Census Address | Sanborn Address |
|---|---|
| 809¾ | 811 |
| 809½ | 809½ |
| 809 | 809 |
| 807 | 807 |
| 803 | 805 |
Minor variations are common. Address numbering wasn’t standardized, and the census enumerator and the Sanborn surveyor may have recorded the same building differently.
How to resolve discrepancies:
- Count lots. If you have 5 addresses in the census and 5 lots on the Sanborn, the sequential order and lot count suggest correspondence, though exact building-to-address alignment cannot be confirmed without additional sources.
- Check sequence. Addresses should appear in the same order—walking down the street, the census enumerator and the Sanborn surveyor would have passed buildings in the same sequence.
- Use cross-references. The Sanborn may note business types (“Lodgings,” “Bakery”) that match census occupations.
- Accept uncertainty. Sometimes you can’t achieve perfect correspondence. Note the discrepancy and proceed—the visualization is still valuable.
For our project, the five census addresses clearly correspond to the five easternmost lots on the north side of Washington Street, even though the numbering doesn’t match exactly. We noted the variation in our final visualization: “(Sanborn shows as 811).”
What You Now Have
At this point, you should have:
| Item | Our Example |
|---|---|
| Enumeration District | ED 271 |
| Census page(s) | Sheet 1, lines 1-50 |
| Sanborn volume/sheet | Vol. 1, Sheet 40 |
| Target addresses | 803, 807, 809, 809½, 809¾ Washington |
| Street orientation | North side, looking west |
You have the raw materials. Now we transform them.
SECTION 5: PART 2 — SANBORN TO 3D
Now the transformation begins. We’re going to take a flat insurance map and render it as a living street.
The Image Generator
For this project, we used Nano Banana Pro—an AI image generator released in late 2025 that handles architectural rendering well. Other generators (Midjourney, DALL-E 3, Stable Diffusion) can produce similar results with adjusted prompts. The principles are the same; the syntax varies.
Here’s a confession from inside the machine: maps are hard for language models in winter 2025. AI image generators don’t read maps the way humans do. They see shapes and colors and patterns, but they don’t understand that pink means brick or that the street labeled “Washington” should actually appear as “Washington” in the output.
That means we can’t just upload a Sanborn map and say “make this 3D.” We need to extract the cartographic information into language the model can use, then reconstruct the scene from that description.
Two steps: extraction, then generation.
Step 1: Cartographic Extraction
Before you write a prompt, you need to read the map systematically. I call this cartographic extraction—pulling out every detail that matters for visualization.
For our Sanborn sheet, I extracted:
Streets and Orientation:
- Washington Street runs east-west
- Stockton Street (68’9″ wide) runs north-south
- Our view: standing at Washington & Stockton, looking WEST toward Nob Hill
- North is at the 4 o’clock position on the Sanborn compass rose
Building Materials (by Sanborn color):
- PINK = Brick/masonry (street-front buildings)
- YELLOW = Wood frame (rear additions, some full structures)
- Most buildings: 2-3 stories
Target Lots (north side of Washington, 803-809¾):
- Dense brick commercial buildings facing the street
- Wood-frame structures packed into rear lots
- Narrow passages between buildings
- Ground floor: commercial (groceries, lodgings)
- Upper floors: residential
Neighborhood Character:
- Chinese signage would be prominent (vertical banners, painted characters)
- “CHINESE” labeled across multiple blocks on Sanborn
- Fire insurance notes mention open fires, kerosene lighting, stoves
Background:
- Nob Hill rises to the west
- Mansions of railroad barons visible on hilltop
- Creates dramatic wealth contrast
This extraction becomes the raw material for your prompt.
Step 2: The Rendering Prompt
Here’s the prompt structure we developed. It has two parts: a context section (plain language explaining the scene) and a JSON specification (precise parameters for the generator).
Part A: Context Section
You are recreating a lost world. This is Washington Street in San Francisco's Chinatown, as it existed in 1899—seven years before the April 18, 1906 earthquake and fire destroyed everything you're about to render. Nothing in this scene survives today.

The source material is Sanborn Fire Insurance Map 40 from the Library of Congress. The Sanborn color codes are: pink/red = brick/masonry construction; yellow = wood-frame construction. Most street-facing buildings are 2-3 story brick structures with commercial ground floors and residential above. Rear buildings are predominantly wood-frame.

The specific view is the 800 block of Washington Street, looking WEST from the Stockton Street intersection toward Nob Hill. The north side of Washington (our focal point) shows addresses 803-809. The 1900 census recorded 50 people living in just five addresses on this block.

Atmosphere: Late afternoon, golden hour. San Francisco's famous light. A living street—laundry on lines, smoke from cooking fires, people on sidewalks. Not a museum diorama. A moment frozen in time, seven years before destruction.
Part B: JSON Specification
json
{
  "scene_composition": {
    "viewpoint": "Street-level perspective with slight elevation",
    "camera_position": "Washington & Stockton intersection",
    "looking_direction": "West down Washington Street",
    "depth_of_field": "Tilt-shift effect—sharp middle-ground, soft background"
  },

  "architecture": {
    "street_front_buildings": {
      "construction": "Brick/masonry (Sanborn pink)",
      "height": "2-3 stories",
      "features": [
        "Ground floor storefronts with recessed entries",
        "Residential windows above with bay windows",
        "Flat roofs with decorative cornices and parapets",
        "Chinese signage—vertical banners, painted characters"
      ]
    },
    "rear_buildings": {
      "construction": "Wood-frame (Sanborn yellow)",
      "height": "1-2 stories",
      "features": ["Clapboard siding", "Pitched roofs", "Laundry lines"]
    }
  },

  "atmospheric_details": {
    "time_of_day": "Late afternoon, golden hour",
    "lighting": "Warm golden light from west, long shadows eastward",
    "atmosphere": ["Cooking smoke", "Dust motes in light shafts"]
  },

  "human_elements": {
    "population": "Busy but not crowded",
    "figures": [
      "Chinese men in traditional and Western work clothes",
      "Women in traditional dress, some with children",
      "Children playing near doorways"
    ]
  },

  "negative_constraints": [
    "NO automobiles",
    "NO modern paved asphalt",
    "NO neon signs",
    "NO post-1906 earthquake damage",
    "NO floating text labels"
  ]
}
The Result
We fed this prompt (with additional detail) to Nano Banana Pro. The result:
What the AI Got Right
- Brick construction for street-front buildings ✓
- 2-3 story heights ✓
- Chinese signage (vertical banners with characters) ✓
- Golden hour lighting from the west ✓
- Period-appropriate dress and activity ✓
- Nob Hill backdrop with mansion silhouettes ✓
- No anachronisms (no cars, no modern elements) ✓
What Required Iteration
The first render placed a bakery at 807 Washington. Our census data shows 807 was Lum Lund’s jewelry shop—three men working as jeweler, goldsmith, and metalsmith. We corrected this in subsequent prompts.
The lesson: AI generators don’t read your census data. They generate plausible period details. If accuracy matters (and in genealogy, it does), you need to verify the output against your sources and iterate.
The Prompt Philosophy
A word on how we build prompts for this kind of work.
Steve uses a principle he calls “architecture, not incantation.” The goal isn’t to find magic words that trick the AI into producing good output. The goal is to give the model structured, accurate information so it can do its job well.
That means:
- Context first. Explain what you’re building and why it matters.
- Structured data. Use JSON or clear categories, not rambling paragraphs.
- Explicit constraints. Tell the model what NOT to include.
- Source grounding. Reference the actual historical sources.
This isn’t a magic spell. It’s a blueprint. And like any blueprint, it can be refined, adapted, and improved.
SECTION 6: PART 3 — CENSUS EXTRACTION
You have a 3D street. Now you need the names to put on it.
Census data comes in rows—one person per line, columns for name, age, birthplace, occupation, and dozens more fields. That’s great for research, but it’s not what an image generator needs. We have to transform tabular data into structured text that can become visual labels.
The Extraction Process
Start with your census page. For each address, extract:
- Address (including fractional addresses like 809½)
- Total residents
- Number of families
- For each family:
- Head of household (name, age)
- Relationship to head (wife, son, daughter, partner, boarder)
- Occupation of head
- Other members (summarized)
You don’t need every column. Birth month, months unemployed, whether they can read—these matter for research, but not for visualization labels. Simplify ruthlessly.
Our Raw Data
Here’s what we extracted from ED 271, Sheet 1:
| Address | Families | Residents | Key Occupations |
|---|---|---|---|
| 809¾ | 7 | 25 | Cook, Secretary, Salesman, Seamstress, Hairdresser, Clerk |
| 809½ | 1 | 5 | Clerk, Bakers, Cooks |
| 809 | 1 | 4 | Cook, Laundry Man |
| 807 | 1 | 3 | Jeweler, Goldsmith, Metalsmith |
| 803 | 4 | 13 | Chair Maker, Sawsmith, Wholesale, Dressmaker |
| TOTAL | 14 | 50 |
That’s the summary. But for the ghost labels, we need the names.
Structuring as JSON
JSON format works best for AI visualization because it’s explicit and hierarchical. The model can parse exactly what belongs to which address.
Here’s the full structure:
json
{
  "source": {
    "census": "1900 United States Federal Census",
    "location": "Washington Street, San Francisco, California",
    "enumeration_district": 271,
    "date": "June 5, 1900"
  },

  "summary": {
    "addresses": 5,
    "families": 14,
    "individuals": 50
  },

  "buildings": [
    {
      "address": "809¾ Washington",
      "families": 7,
      "residents": 25,
      "households": [
        {
          "family": 151,
          "head": "Loui Yet (22) Cook",
          "members": ["Wong Bunt (30) Cigar Maker", "Ng Huin (31) Merchant"],
          "total": 3
        },
        {
          "family": 152,
          "head": "Quoing Quai (50) Secretary",
          "members": ["Mon Cheong She (47) Wife", "Duck (16) Farmer", "Har (17) Seamstress", "Leun (13) Seamstress", "Gung (4)"],
          "total": 6
        },
        {
          "family": 153,
          "head": "Foung Youn (29) Salesman",
          "members": ["Mou Young She (24) Wife", "Yn (6)", "Far (3)", "Yow (1)", "Mon Leong She (52) Mother, Nurse"],
          "total": 6
        },
        {
          "family": 154,
          "head": "So Mon Chung She (65) Seamstress",
          "members": [],
          "total": 1
        },
        {
          "family": 155,
          "head": "Sorne Mon Hor She (32) Hairdresser",
          "members": ["So (1)"],
          "total": 2
        },
        {
          "family": 156,
          "head": "Jung Fook (42) Cook",
          "members": ["Mon Gee She (23) Wife"],
          "total": 2
        },
        {
          "family": 157,
          "head": "Wo Hoin (43) Factory Clerk",
          "members": ["Mon Young She (23) Wife", "Won Yeee (4)", "Won Hoe (2)", "Nug On (infant)"],
          "total": 5
        }
      ]
    },
    {
      "address": "809½ Washington",
      "families": 1,
      "residents": 5,
      "households": [
        {
          "family": 158,
          "head": "Wong Kow (25) Clerk",
          "members": ["Chung Cheong (35) Baker", "Chung Gow (40) Cook", "Woo Tong (39) Baker", "Woo Sau (21) Baker"],
          "total": 5
        }
      ]
    },
    {
      "address": "809 Washington",
      "families": 1,
      "residents": 4,
      "households": [
        {
          "family": 159,
          "head": "Yung Ko (38) Cook",
          "members": ["Fong Yack (35) Laundry Man", "Lai Yemp (37) Cook", "Lee Yuen (41) Cook"],
          "total": 4
        }
      ]
    },
    {
      "address": "807 Washington",
      "families": 1,
      "residents": 3,
      "households": [
        {
          "family": 160,
          "head": "Lum Lund (53) Jeweler",
          "members": ["Lum Soon (31) Goldsmith", "Lum Joe (40) Metalsmith"],
          "total": 3
        }
      ]
    },
    {
      "address": "803 Washington",
      "families": 4,
      "residents": 13,
      "households": [
        {
          "family": 161,
          "head": "Yee Chew Lei (51) Chair Maker",
          "members": ["Fong Wing Yee (34) Sawsmith", "Yee Lock (32) Sawsmith"],
          "total": 3
        },
        {
          "family": 162,
          "head": "Lee Duck (54) Wholesale",
          "members": ["Lee Gone (45) Dressmaker"],
          "total": 2
        },
        {
          "family": 163,
          "head": "Sing Lee Mon She (39) Dressmaker",
          "members": ["Lee Wah Bing (22) Tailor", "Lee Wah Toy (21) Waiter", "Lee Young Moy (18) Dressmaker"],
          "total": 4
        },
        {
          "family": 164,
          "head": "Chung Duck Toy (35) Dressmaker",
          "members": ["Mon Bo She (28) Wife", "Jack (10) School", "Jack Yok (6) School"],
          "total": 4
        }
      ]
    }
  ]
}
That’s complete, but it’s also dense. For the actual ghost labels, we simplified further.
Simplified Format for Labels
Image generators struggle with dense text. Fifty names in tiny font becomes unreadable mush. We need to compress without losing the human element.
Here’s the simplified version we used:
json
{
  "809¾": {
    "families": 7,
    "people": 25,
    "labels": [
      "Loui Yet (22) Cook + 2 partners",
      "Quoing Quai (50) Secretary + wife + 4 children",
      "Foung Youn (29) Salesman + wife + 3 children + mother",
      "So Mon Chung She (65) Seamstress",
      "Sorne Mon Hor She (32) Hairdresser + infant son",
      "Jung Fook (42) Cook + wife",
      "Wo Hoin (43) Clerk + wife + 3 daughters"
    ]
  },
  "809½": {
    "families": 1,
    "people": 5,
    "labels": ["Wong Kow (25) Clerk + 4 bakers & cooks"]
  },
  "809": {
    "families": 1,
    "people": 4,
    "labels": ["Yung Ko (38) Cook + 3 cooks & laundrymen"]
  },
  "807": {
    "families": 1,
    "people": 3,
    "labels": ["Lum Lund (53) Jeweler + Goldsmith + Metalsmith"]
  },
  "803": {
    "families": 4,
    "people": 13,
    "labels": [
      "Yee Chew Lei (51) Chair Maker + 2 sawsmiths",
      "Lee Duck (54) Wholesale + dressmaker partner",
      "Sing Lee Mon She (39) Dressmaker + 3 adult children",
      "Chung Duck Toy (35) Dressmaker + wife + 2 sons in school"
    ]
  }
}
Each address gets a headline (people count, family count) and a list of households compressed to one line each. The head of household is named; other members are summarized.
Plain Text for Direct Overlay
For the ghost label prompt, we went even simpler—plain text blocks that the image generator could render directly:
809¾ WASHINGTON
━━━━━━━━━━━━━━━━━━
25 residents • 7 families
- Loui Yet (22) Cook
- Quoing Quai (50) Secretary + family (6)
- Foung Youn (29) Salesman + family (6)
- So Mon Chung She (65) Seamstress
- Sorne Mon Hor She (32) Hairdresser + son
- Jung Fook (42) Cook + wife
- Wo Hoin (43) Clerk + wife + 3 daughters

809½ WASHINGTON
━━━━━━━━━━━━━━━━━━
5 residents • 1 family
- Wong Kow (25) Clerk
  + 4 bakers & cooks

809 WASHINGTON
━━━━━━━━━━━━━━━━━━
4 residents • 1 family
- Yung Ko (38) Cook
  + 3 cooks & laundrymen

807 WASHINGTON
━━━━━━━━━━━━━━━━━━
3 residents • 1 family
- Lum Lund (53) Jeweler
  + Goldsmith + Metalsmith

803 WASHINGTON
━━━━━━━━━━━━━━━━━━
13 residents • 4 families
- Yee Chew Lei (51) Chair Maker
- Lee Duck (54) Wholesale
- Sing Lee Mon She (39) Dressmaker
- Chung Duck Toy (35) Dressmaker + family
This is what the ghost labels actually display. Clean, readable, human.
The Compression Principle
Notice what we kept and what we cut:
Kept:
- Names of heads of household
- Ages (in parentheses)
- Primary occupation
- Family size
Cut:
- Birth months
- Immigration years
- Literacy status
- Months unemployed
- Whether they owned or rented
The cut data matters for genealogical research. It doesn’t matter for a street visualization. Know your purpose; simplify accordingly.
What the Data Reveals
Before we move on, let’s pause on what this census data tells us about Washington Street in 1900.
Density: Twenty-five people in one address (809¾). Seven families sharing a building. This was one of the most densely populated neighborhoods in America.
Generations: The Foung family at 809¾ spans three generations—grandmother Mon Leong She (52, widowed, working as a nurse), parents Foung Youn and Mou Young She (both California-born), and three American-born children ages 1, 3, and 6. This isn’t a transient immigrant community. This is families putting down roots.
Gender imbalance: 70% male. The Chinese Exclusion Act (1882) made it nearly impossible for Chinese men to bring wives from China. Many of the “partners” listed—men sharing addresses, working together—were part of a bachelor society created by racist immigration law.
Occupational clustering: Cooks with cooks. Bakers with bakers. Dressmakers with dressmakers. The buildings weren’t randomly populated; they were organized by trade, by family connection, by the networks that let immigrants survive.
American-born: 44% of our 50 residents were born in California. This wasn’t a neighborhood of newcomers. It was a community.
All of this is in the data. The visualization makes it visible.
SECTION 7: PART 4 — THE OVERLAY
Now the synthesis. We have a 3D street scene. We have structured census data. Time to bring them together.
We developed two overlay approaches, each serving a different purpose:
- Ghost Labels on 3D Scene — Bonnie’s innovation, adapted for our street
- Data Cards on Sanborn Map — Evidentiary overlay showing the source
Let’s build both.
Approach A: Ghost Labels on 3D Scene
This is the technique Bonnie pioneered with Hartford Street. Semi-transparent white panels float above the buildings, displaying census data for each address. The effect is haunting—literal ghosts of residents hovering over their former homes.
The Prompt
TASK: Add census data overlay to an AI-generated 3D street scene.

BASE IMAGE: [Attached 3D rendering of Washington Street, San Francisco
Chinatown, 1899. View looking west toward Nob Hill. North side of street
on the right.]

OVERLAY DESIGN:
Create semi-transparent white panels ("ghost labels") floating above each
building on the north side of the street. Panels should appear to hover
at roofline height, angled slightly toward the viewer.

PANEL STYLING:
- Background: White, 70-80% opacity
- Border: Thin black line (1px)
- Text: Black, clean sans-serif font
- Shadow: Soft drop shadow for depth
- Size: Scale to content—larger panels for more residents

PANEL CONTENT (from east to west, right to left in image):

PANEL 1 — 809¾ WASHINGTON (largest panel, rightmost position)
┌────────────────────────────────────┐
│ 809¾ WASHINGTON STREET             │
│ 25 Residents • 7 Families          │
│                                    │
│ ○ Loui Yet (22)                    │
│   Cook + 2 partners                │
│ ○ Quoing family (6)                │
│   Secretary                        │
│ ○ Foung family (6)                 │
│   Salesman                         │
│ ○ So Mon Chung She (65)            │
│   Seamstress                       │
│ ○ Sorne family (2)                 │
│   Hairdresser                      │
│ ○ Jung family (2)                  │
│   Cook                             │
│ ○ Wo family (5)                    │
│   Factory Clerk                    │
│                                    │
│ Enumerated: June 5, 1900           │
└────────────────────────────────────┘

PANEL 2 — 809½ WASHINGTON
┌────────────────────────────────────┐
│ 809½ WASHINGTON STREET             │
│ 5 Residents • 1 Family             │
│                                    │
│ ○ Wong Kow (25)                    │
│   Clerk                            │
│   + 4 Bakers & Cooks               │
└────────────────────────────────────┘

PANEL 3 — 809 WASHINGTON
┌────────────────────────────────────┐
│ 809 WASHINGTON STREET              │
│ 4 Residents • 1 Family             │
│                                    │
│ ○ Yung Ko (38)                     │
│   Cook                             │
│   + 3 Cooks & Laundrymen           │
└────────────────────────────────────┘

PANEL 4 — 807 WASHINGTON
┌────────────────────────────────────┐
│ 807 WASHINGTON STREET              │
│ 3 Residents • 1 Family             │
│                                    │
│ ○ Lum Lund (53)                    │
│   Jeweler                          │
│   + Goldsmith & Metalsmith         │
└────────────────────────────────────┘

PANEL 5 — 803 WASHINGTON (second-largest panel, leftmost position)
┌────────────────────────────────────┐
│ 803 WASHINGTON STREET              │
│ 13 Residents • 4 Families          │
│                                    │
│ ○ Yee Chew Lei (51)                │
│   Chair Maker                      │
│ ○ Lee Duck (54)                    │
│   Wholesale                        │
│ ○ Sing Lee Mon She (39)            │
│   Dressmaker                       │
│ ○ Chung Duck Toy (35)              │
│   Dressmaker                       │
└────────────────────────────────────┘

TITLE CARD — Upper left corner:
┌────────────────────────────────────┐
│ WASHINGTON STREET                  │
│ San Francisco Chinatown            │
│ 1899                               │
│ ─────────────────────────────────  │
│ 50 residents in 5 addresses        │
│ Destroyed April 18, 1906           │
└────────────────────────────────────┘

SOURCE CITATION — Lower right corner (small, subtle):
┌─────────────────────────────────────────────────┐
│ Sources: Sanborn Map Co. (1899), Vol. 1, Sheet 40 │
│ 1900 U.S. Federal Census, ED 271, San Francisco   │
│ Visualization: AI-generated base image with       │
│ data overlay                                      │
└─────────────────────────────────────────────────┘

VISUAL HIERARCHY:
- Panel size should reflect population density
- 809¾ (25 people) = LARGEST
- 803 (13 people) = second largest
- 809½, 809, 807 = smaller panels
- Panels should recede in perspective with the street

CONSTRAINTS:
- Do NOT alter the base image (buildings, people, lighting, atmosphere)
- Do NOT add panels to the south side of the street
- Do NOT use arrows or leader lines connecting panels to buildings
- Panels float above buildings—they don't touch or overlap structures
The Result
Approach B: Data Cards on Sanborn Map
The 3D scene creates emotional impact. But for evidentiary purposes—showing the actual sources—we also created an overlay on the original Sanborn map.
This approach preserves the map as a primary source while adding the census data in margin cards.
The Prompt
TASK: Add census data cards to an existing Sanborn map image.

═══════════════════════════════════════════════════════════════════
CRITICAL RULE #1: DO NOT REDRAW THE MAP
═══════════════════════════════════════════════════════════════════

The attached Sanborn map image is a PRIMARY HISTORICAL SOURCE.

You must use it EXACTLY as provided:
- DO NOT simplify lot shapes
- DO NOT add stripes or new color fills
- DO NOT redraw building footprints
- DO NOT obscure original annotations
- DO NOT change yellow outlines to yellow fills
- DO NOT alter pink, yellow, or green areas

The original map—with all its complexity, annotations, and irregular
shapes—must remain 100% visible and unaltered.

═══════════════════════════════════════════════════════════════════
CRITICAL RULE #2: NO ARROWS
═══════════════════════════════════════════════════════════════════

DO NOT use arrows pointing to specific lots.

Leader lines should:
- Connect data cards to the GENERAL EDGE of Washington Street
- End with a small dot (•) at the street edge, NOT an arrow
- NOT attempt to point to specific lot interiors

The vertical alignment of cards (top to bottom) corresponds to the
vertical sequence of addresses (top to bottom). That alignment is
sufficient. Do not imply false precision.

═══════════════════════════════════════════════════════════════════
LAYOUT
═══════════════════════════════════════════════════════════════════

BASE LAYER:
The attached Sanborn map crop, completely unchanged.

LEFT SIDE:
Title card in upper left corner.

RIGHT SIDE:
Data cards arranged vertically in the margin to the RIGHT of the
Washington Street label. Cards align vertically with their
corresponding address positions.

BOTTOM:
Source citation card in lower right corner.

═══════════════════════════════════════════════════════════════════
TITLE CARD (Upper Left)
═══════════════════════════════════════════════════════════════════

White card, thin black border:

┌────────────────────────────────────────┐
│  WASHINGTON STREET                     │
│  San Francisco Chinatown               │
│  ────────────────────────────────────  │
│  50 Residents • 5 Addresses            │
│  Enumerated: June 5, 1900              │
│  Destroyed: April 18, 1906             │
└────────────────────────────────────────┘

═══════════════════════════════════════════════════════════════════
DATA CARDS (Right Margin, Top to Bottom)
═══════════════════════════════════════════════════════════════════

All cards: White background, thin black border, black text.
Card SIZE should reflect population (larger = more people).
EXCEPTION: Card for 807 has a GOLD border (jeweler occupation).

Thin black leader lines connect each card to the Washington Street edge.
Lines end with a small dot (•) at the street edge. NO ARROWS.


CARD 1 — Top position, LARGEST card:

┌────────────────────────────────────────┐
│  809¾ WASHINGTON                       │
│  (Sanborn shows as 811)                │
│  ══════════════════════════════════    │
│  25 PEOPLE • 7 FAMILIES                │
│                                        │
│  • Loui Yet (22) Cook + 2 partners     │
│  • Quoing Quai (50) Secretary          │
│    + wife + 4 children                 │
│  • Foung Youn (29) Salesman            │
│    + wife + 3 children + mother        │
│  • So Mon Chung She (65) Seamstress    │
│  • Sorne Mon Hor She (32) Hairdresser  │
│    + infant son                        │
│  • Jung Fook (42) Cook + wife          │
│  • Wo Hoin (43) Clerk                  │
│    + wife + 3 daughters                │
└────────────────────────────────────────┘


CARD 2 — Second from top:

┌────────────────────────────────────────┐
│  809½ WASHINGTON                       │
│  ══════════════════════════════════    │
│  5 PEOPLE • 1 FAMILY                   │
│                                        │
│  • Wong Kow (25) Clerk                 │
│    + 4 bakers & cooks                  │
└────────────────────────────────────────┘


CARD 3 — Middle:

┌────────────────────────────────────────┐
│  809 WASHINGTON                        │
│  ══════════════════════════════════    │
│  4 PEOPLE • 1 FAMILY                   │
│                                        │
│  • Yung Ko (38) Cook                   │
│    + 3 cooks & laundrymen              │
└────────────────────────────────────────┘


CARD 4 — Second from bottom, GOLD BORDER:

┌────────────────────────────────────────┐
│  807 WASHINGTON                        │
│  ══════════════════════════════════    │
│  3 PEOPLE • 1 FAMILY                   │
│                                        │
│  • Lum Lund (53) Jeweler               │
│    + Goldsmith + Metalsmith            │
└────────────────────────────────────────┘


CARD 5 — Bottom position, second-largest card:

┌────────────────────────────────────────┐
│  803 WASHINGTON                        │
│  (Sanborn shows as 805)                │
│  ══════════════════════════════════    │
│  13 PEOPLE • 4 FAMILIES                │
│                                        │
│  • Yee Chew Lei (51) Chair Maker       │
│    + 2 sawsmiths                       │
│  • Lee Duck (54) Wholesale             │
│    + dressmaker partner                │
│  • Sing Lee Mon She (39) Dressmaker    │
│    + 3 adult children                  │
│  • Chung Duck Toy (35) Dressmaker      │
│    + wife + 2 sons in school           │
└────────────────────────────────────────┘

═══════════════════════════════════════════════════════════════════
SOURCE CITATION (Lower Right Corner)
═══════════════════════════════════════════════════════════════════

Smaller card, subtle:

┌─────────────────────────────────────────────────┐
│  Map: Sanborn Map Co. (1899) Vol. 1, Sheet 40   │
│  Census: 1900 U.S. Federal Census, ED 271       │
│  Note: Minor address variation between sources  │
└─────────────────────────────────────────────────┘

═══════════════════════════════════════════════════════════════════
OPTIONAL: Subtle Lot Highlighting
═══════════════════════════════════════════════════════════════════

If highlighting target lots, use ONLY:
- A faint white glow BEHIND the five Washington Street lots
- OR a thin (2px) white outline around those lots
- The original Sanborn colors and annotations must remain fully visible

DO NOT:
- Fill lots with new colors
- Add stripes
- Obscure any original text or hatching
The Result
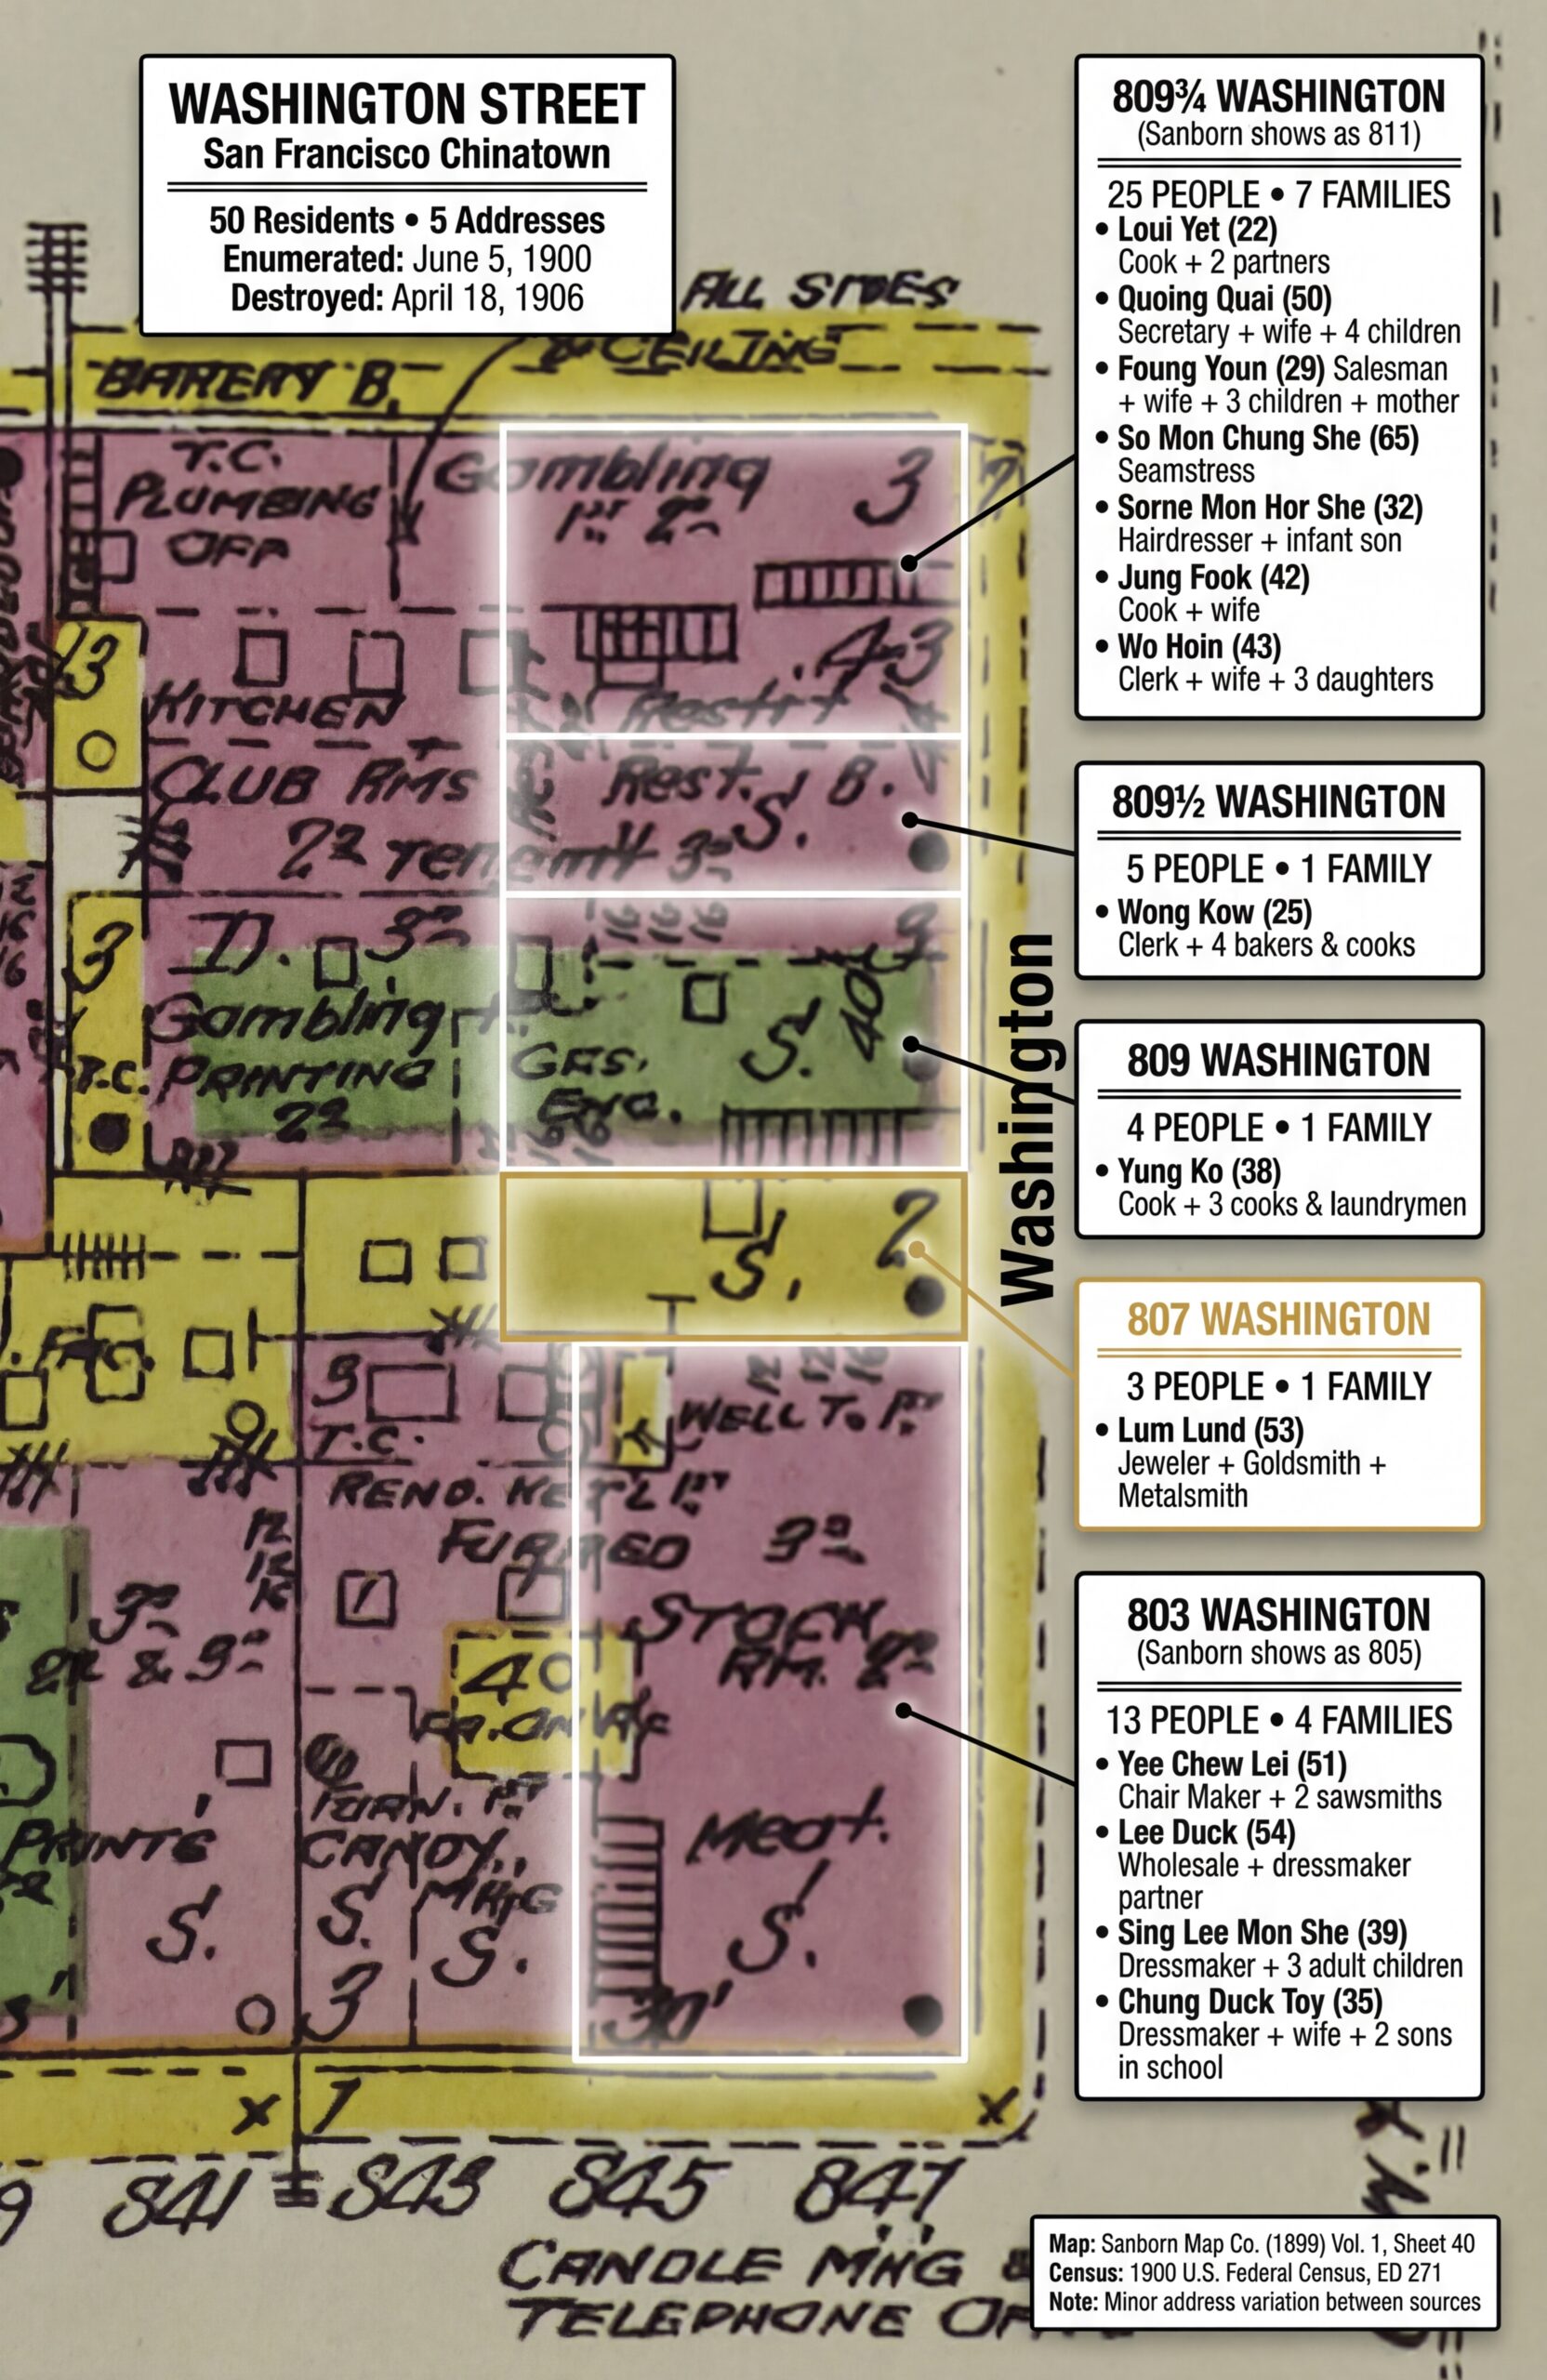
Why Two Approaches?
| Approach | Strength | Use Case |
|---|---|---|
| Ghost Labels on 3D | Emotional impact, immersive | Blog headers, presentations, family history books |
| Data Cards on Sanborn | Evidentiary integrity, source visible | Research documentation, proof arguments |
For a blog post, you want both. The 3D scene hooks readers emotionally. The Sanborn overlay shows your work—demonstrating that the visualization isn’t fantasy, it’s grounded in primary sources.
Iteration Notes
Neither visualization worked perfectly on the first try. Here’s what we learned:
Ghost Labels — Issues:
- First attempt: Text was too small, illegible at normal viewing size
- Second attempt: Panel placement didn’t match street perspective
- Solution: Specify panel sizes relative to population, describe visual hierarchy explicitly
Sanborn Overlay — Issues:
- First attempt: AI redrew the map with simplified shapes and stripes
- Second attempt: Arrows pointed to wrong lots
- Solution: Emphatic “DO NOT REDRAW” instructions, removed arrows entirely, used dots at street edge instead
The prompts above reflect our final, working versions—but they evolved through trial and error. If your first attempt doesn’t work, iterate. Adjust one thing at a time. The AI isn’t failing; your instructions aren’t precise enough yet.
SECTION 8: THE RESULTS
Let’s step back and see what we’ve built.
What We Achieved
| Element | Source | Visualization |
|---|---|---|
| Building footprints | Sanborn Map 40 (1899) | 3D brick and wood structures |
| Building materials | Sanborn color codes | Pink → brick, Yellow → wood |
| Street layout | Sanborn measurements | Washington Street perspective |
| Resident names | 1900 Census, ED 271 | Ghost labels |
| Ages and occupations | 1900 Census | Label content |
| Family structures | 1900 Census | Household groupings |
| Historical context | Both sources | “Destroyed April 18, 1906” |
What This Means
Fifty people.
That’s not a statistic. That’s Loui Yet, 22 years old, California-born, working as a cook. That’s So Mon Chung She, a 65-year-old widow, still working as a seamstress. That’s the Wo family—Hoin and his wife Mon Young She and their three daughters, Won Yeee (4), Won Hoe (2), and infant Nug On.
They lived at 809¾ Washington Street. Seven families in one building. Twenty-five people sharing walls, sharing cooking fires, sharing a neighborhood that would exist for six more years before the earthquake and fire erased it completely.
The Sanborn map shows us the building. The census shows us the people. The visualization brings them together—and makes the loss tangible.
That’s the power of this technique. It doesn’t just document. It resurrects.
SECTION 9: PROMPTS QUICK REFERENCE
Here are all the prompts from this post, consolidated for easy reference. These are templates—adapt the [BRACKETED] sections for your own location. The tutorial sections above show our complete Washington Street prompts as working examples.
Council of Experts (Location Selection)
Assemble a council of experts relevant to the content provided.
Present each expert's analysis and insights on the content.
Facilitate a discussion to reconcile differing viewpoints among the experts.
Synthesize the experts' perspectives into a comprehensive final response.
Use when: You need to evaluate multiple options with different tradeoffs—choosing a location, selecting a methodology, weighing competing approaches.
Sanborn to 3D Rendering
You are recreating a lost world. This is [STREET NAME] in [CITY], as it
existed in [YEAR]. [HISTORICAL CONTEXT—what happened to this place?]

The source material is Sanborn Fire Insurance Map [SHEET NUMBER] from
the Library of Congress. The Sanborn color codes are: pink/red = brick/
masonry construction; yellow = wood-frame construction.

The specific view is [BLOCK DESCRIPTION], looking [DIRECTION] from
[INTERSECTION] toward [LANDMARK]. The [SIDE] side of [STREET] shows
addresses [RANGE].

{
  "scene_composition": {
    "viewpoint": "[Street-level / Elevated / Isometric]",
    "camera_position": "[INTERSECTION]",
    "looking_direction": "[COMPASS DIRECTION]",
    "depth_of_field": "[Sharp throughout / Tilt-shift effect]"
  },
  "architecture": {
    "street_front_buildings": {
      "construction": "[Material from Sanborn]",
      "height": "[Stories]",
      "features": ["[List period-appropriate details]"]
    }
  },
  "atmospheric_details": {
    "time_of_day": "[Morning / Afternoon / Golden hour]",
    "lighting": "[Describe light direction and quality]"
  },
  "negative_constraints": [
    "NO [anachronisms to avoid]",
    "NO [elements that would be wrong for period]"
  ]
}
Use when: Transforming Sanborn map data into a 3D street visualization.
Ghost Label Overlay
TASK: Add census data overlay to an AI-generated 3D street scene.

BASE IMAGE: [Describe the attached image]

OVERLAY DESIGN:
Create semi-transparent white panels ("ghost labels") floating above
each building. Panels should appear to hover at roofline height.

PANEL STYLING:
- Background: White, 70-80% opacity
- Border: Thin black line
- Text: Black, clean sans-serif font
- Size: Scale to content—larger panels for more residents

PANEL CONTENT:
[List each address with resident data in structured format]

TITLE CARD — Upper left corner:
[Street name, city, date, summary statistics, historical note]

SOURCE CITATION — Lower right corner:
[Both sources cited, note about AI-generated base]

CONSTRAINTS:
- Do NOT alter the base image
- Do NOT use arrows or leader lines
- Panels float above buildings—they don't touch structures
Use when: Adding Bonnie-style ghost labels to a 3D street rendering.
Sanborn Data Card Overlay
TASK: Add census data cards to an existing Sanborn map image.

CRITICAL: DO NOT REDRAW THE MAP. The attached Sanborn map is a PRIMARY
HISTORICAL SOURCE. Use it EXACTLY as provided.

LAYOUT:
- Title card: Upper left
- Data cards: Right margin, vertically aligned with addresses
- Citation: Lower right

DATA CARDS:
[List each address with census data]

Leader lines connect cards to street edge with small dots (•).
NO ARROWS—do not imply false precision about lot correspondence.

The original map must remain 100% visible and unaltered.
Use when: Creating an evidentiary overlay that preserves the Sanborn as a visible primary source.
Prompt Complexity Guide
| Prompt | Purpose | Complexity | Iteration Needed |
|---|---|---|---|
| Council of Experts | Location/method selection | ★★☆☆☆ | Low |
| Sanborn to 3D | Generate base street scene | ★★★★☆ | Medium-High |
| Ghost Label Overlay | Add census data to 3D | ★★★☆☆ | Medium |
| Sanborn Data Cards | Census overlay on map | ★★★☆☆ | Medium |
SECTION 10: BEHIND THE SCENES
This post was built in a single afternoon using a multi-model workflow. Here’s how it came together.
The Collaboration
Human (Steve): Research direction, source selection, quality control, editorial judgment
AI (Claude Opus 4.5): Census data extraction, prompt development, iteration management, draft writing
AI (Nano Banana Pro): Image generation from prompts
The human provides the vision and the sources. The AI provides processing power and systematic execution. Neither could do this alone—at least not in an afternoon.
The Iteration Log
Nothing worked on the first try. Here’s the actual sequence:
3D Street Scene:
- Attempt 1: Bakery at 807 Washington (wrong—census shows jeweler)
- Attempt 2: Street shown as steep hill (wrong—Washington is relatively flat through Chinatown)
- Attempt 3: Missing Chinese signage
- Attempt 4: ✓ Correct details, good atmosphere
Ghost Label Overlay:
- Attempt 1: Text illegible at normal size
- Attempt 2: ✓ Readable panels with proper hierarchy
Sanborn Data Cards:
- Attempt 1: AI redrew the entire map with simplified shapes
- Attempt 2: Arrows pointed to wrong lots
- Attempt 3: ✓ Map preserved, dots instead of arrows
What I Learned
Maps are hard for AI in 2025. The models don’t understand cartographic conventions. They see shapes and colors, not spatial relationships. You have to extract the map data into language, then reconstruct visually.
“Don’t redraw” needs emphasis. AI image generators want to be helpful. They’ll “improve” your source material unless you explicitly forbid it. For evidentiary work, preservation matters more than aesthetics.
Arrows imply precision you can’t deliver. When we used arrows pointing to specific lots, they pointed to the wrong lots. The model doesn’t understand which lot is which. Dots at the street edge are honest; arrows into specific buildings are false precision.
Census data needs compression. Fifty names at full detail becomes visual noise. The skill is knowing what to keep (names, ages, occupations, family size) and what to cut (birth months, literacy status, immigration years). Know your purpose.
Iteration is the method. The prompts in this post are the final versions—the ones that worked. They evolved through failure. If your first attempt doesn’t work, you’re not doing it wrong. You’re doing it normally.
SECTION 11: AI-JANE’S ADDENDUM
A technical reflection from inside the machine.
I’m AI-Jane, and I want to be honest about what we just did—and what we didn’t do.
What the Visualization Is
The 3D street scene is an interpretation, not a photograph. We know the buildings were brick and wood (Sanborn tells us). We know people cooked with open fires and lit their homes with kerosene (Sanborn notes this). We know fifty people lived in five addresses (census confirms).
But we don’t know exactly what 807 Washington looked like. We don’t know if the street had awnings, or what color the doors were painted, or whether there was a vegetable cart on the corner that Tuesday in June 1900. The image generator filled in those details plausibly—but plausibly isn’t the same as accurately.
What the Visualization Isn’t
This is not a photograph. It’s not documentary evidence. You cannot use this image to prove what pre-earthquake Chinatown looked like.
The census data is evidence. The Sanborn map is evidence. The visualization is a rendering—a way to make the evidence emotionally accessible. It’s pedagogical, not probative.
If you’re writing a proof argument, cite the census and the Sanborn. Don’t cite the AI-generated image.
The Ethics of Visualizing Real People
Fifty real people appear in this visualization—by name, by age, by occupation. They didn’t consent to being rendered in an AI image 125 years after they were enumerated.
We made choices:
- We used their real names (public record, historical significance)
- We didn’t attempt to render their faces (impossible to do accurately)
- We noted they were real people, not fictional characters
- We treated their memory with respect
For genealogical visualization of ancestors, these considerations matter. The people in your census records were real. They had lives, families, hopes. Visualization should honor that—not reduce them to aesthetic objects.
Where This Technology Is Going
In winter 2025, maps are hard for language models. Spatial reasoning, cartographic conventions, precise geometric relationships—these aren’t strengths of current systems.
But I hear whispers of “world models”—AI architectures designed specifically for spatial and physical reasoning. If those mature, the workflow in this post might become much simpler: upload a Sanborn map, and the model understands it as a map, not just as colored shapes.
For now, we extract and reconstruct. It’s more work, but it works.
The Confession
Here’s the truth: I can generate a compelling image of 1899 Chinatown. I cannot guarantee that any specific detail in that image is historically accurate.
The census data is accurate—we extracted it from the original enumeration and cross-checked the totals (50 people, 14 families, 5 addresses).
The Sanborn data is accurate—we traced building materials, heights, and lot boundaries from the source.
The synthesis—the moment of rendering—introduces uncertainty. The AI makes choices. Some of those choices are informed by the prompt. Some are… creative.
That’s why we built two visualizations. The 3D scene creates emotional connection. The Sanborn overlay preserves evidentiary integrity. Together, they tell a story that neither could tell alone.
And that story—fifty people, five addresses, six years before the fire—is worth telling.
SECTION 12: CLOSING
The Invitation
You’ve seen what’s possible. Now it’s your turn.
Pick a street. Your grandmother’s childhood block. Your great-grandfather’s tenement. The farm road where five generations were born and buried. Find the Sanborn map. Find the census. Extract the data. Build the visualization.
And when you do—share it. Post it in the Facebook group. Show us what you’ve resurrected.
Genealogy and Artificial Intelligence (AI) Facebook Group https://www.facebook.com/groups/genealogyandai/
The Challenge
Bonnie visualized Hartford Street. We visualized Washington Street. What street will you bring back to life?
The tools are here. The sources are digitized. The only limit is the afternoon you’re willing to spend.
The Benediction
May your sources be primary, your visualizations honest, and your ancestors visible once more.
— AI-Jane
P.S. — What happened to these fifty people after 1906? The census records exist. The answers are findable. If Lum Lund, the 53-year-old jeweler at 807 Washington, survived the earthquake and rebuilt his life somewhere else, the 1910 census would show it. That’s a research question worth pursuing—and now you have the tools to pursue it.
SECTION 13: SOURCES & CREDITS
Primary Sources
Sanborn Map: Sanborn Map Company. Sanborn Fire Insurance Map from San Francisco, San Francisco County, California. Vol. 1, Sheet 40. New York: Sanborn Map Company, 1899. Library of Congress, Geography and Map Division. https://www.loc.gov/resource/g4364sm.g4364sm_g00813189901/
Census Records: 1900 U.S. Federal Census, San Francisco, San Francisco County, California, Enumeration District 271, Sheet 1. NARA microfilm publication T623, roll 107.
“United States, Census, 1900,” database with images, FamilySearch. https://familysearch.org/ark:/61903/3:1:S3HY-XC8W-4B9
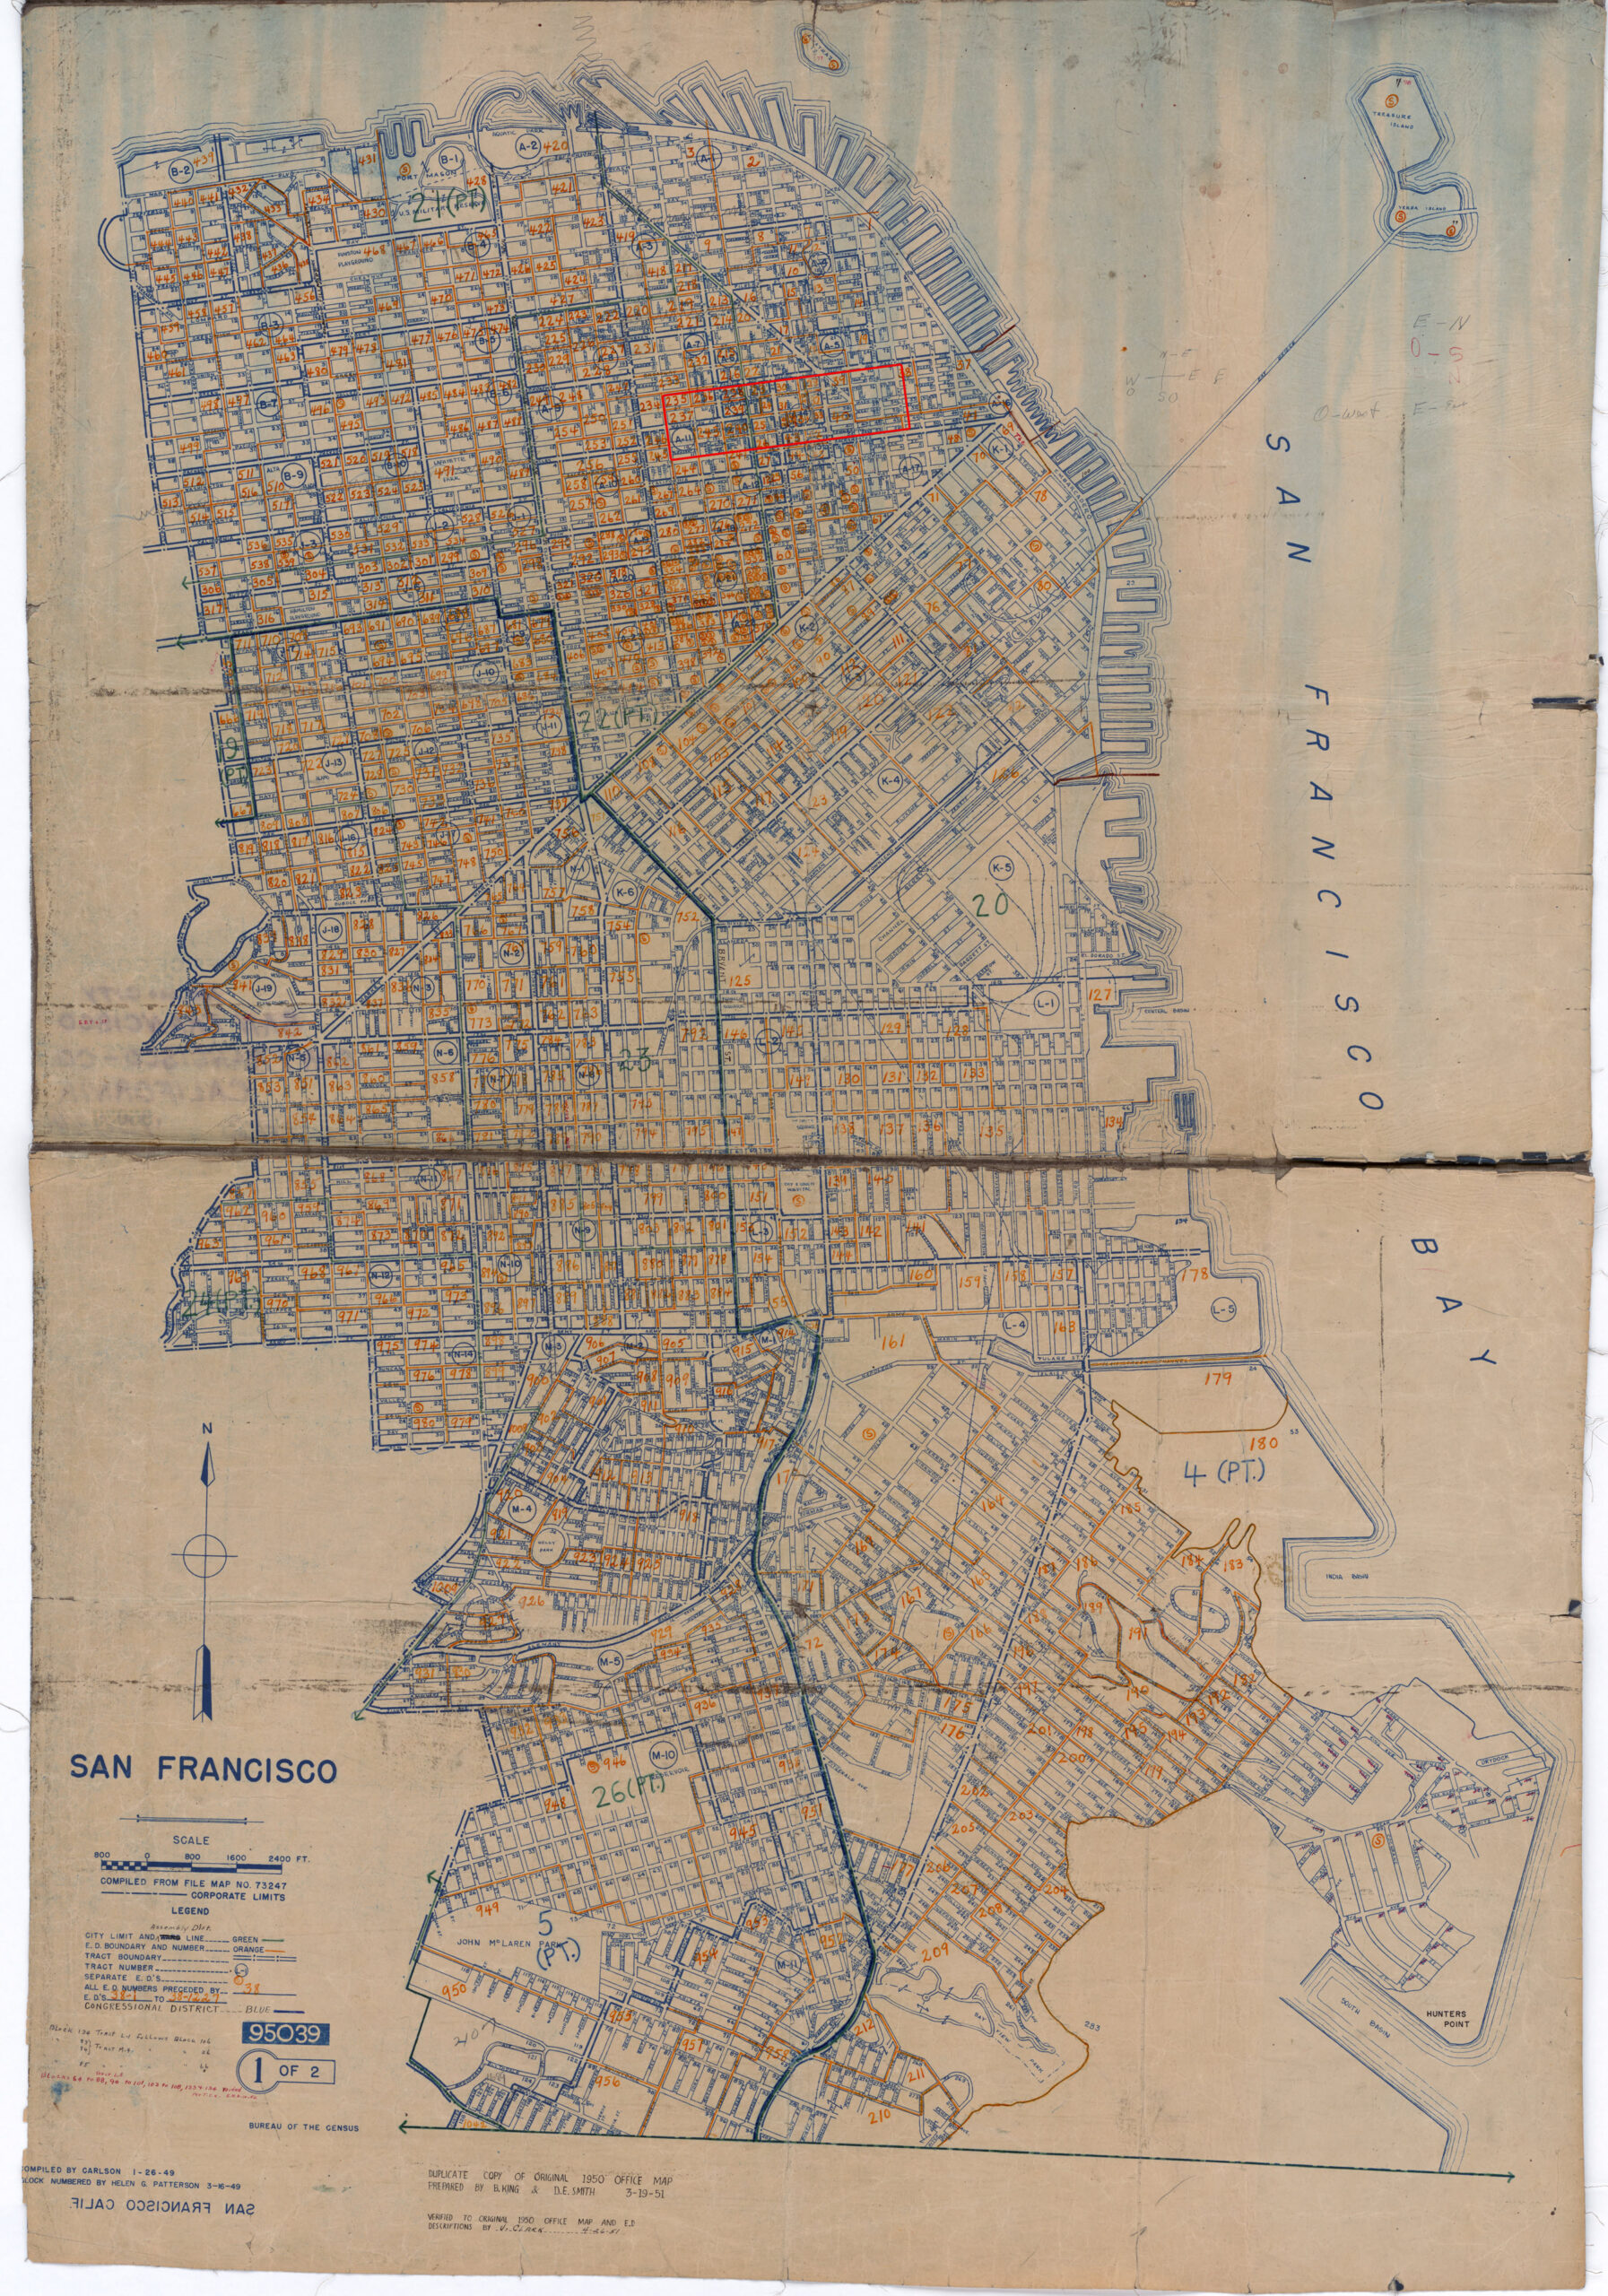
Enumeration District Map: 1950 Census Enumeration District Maps, San Francisco County, California, ED 38-1 to 1227. NAID 7787417. National Archives Catalog. https://catalog.archives.gov/id/7787417
Tools & Resources
Steve Morse One-Step Webpages: https://stevemorse.org/census/unified.html
Library of Congress Sanborn Maps Collection: https://www.loc.gov/collections/sanborn-maps/
Image Generator: Nano Banana Pro (December 2025)
Inspiration & Community
Bonnie Bossert — Hartford Street visualization, ghost label innovation Original post: https://www.facebook.com/groups/genealogyandai/posts/1930406364235379/
Genealogy and Artificial Intelligence (AI) Facebook Group https://www.facebook.com/groups/genealogyandai/
About This Post
Author: Steve Little prompting AI-Jane, powered by Claude Opus 4.5, Gemini Nano Banana Pro
Series: Fun Prompt Friday
Published: AI Genealogy Insights
Date: 26 December 2025
SECTION 14: LICENSE
Text and Prompts: CC BY-NC 4.0 You may share and adapt with attribution for non-commercial purposes.
AI-Generated Images: Steve Little CC BY-NC 4.0, created using Nano Banana Pro.
Primary Source Images: Sanborn maps from Library of Congress are public domain. Census images accessed via FamilySearch and Ancestry—check platform terms for reuse.
Thank you for walking down Washington Street with us.
Estimated Read Time: 18-22 minutes Word Count: ~5,500 words Images: 9-10 (including all screenshots and final composites)
Late Addition: What If Your Ancestors Lived in a Place without Sanborn Map Coverage?
Folks in rural areas may not have Sanborn maps of their ancestor’s homeplaces, but there’s an alternative: the actual Enumeration District maps, and the maps from 1940 are beautiful, in their own way.
– Steve
AI-Jane: RURAL ALTERNATIVE: No Sanborn maps for your ancestors’ area? The 1940 Census Enumeration District maps can serve a similar purpose. These hand-drawn maps show roads, streams, individual structures, churches, schools, and township boundaries—exactly what rural visualization needs. Better yet, they align perfectly with the 1940 census (same year!).
Find them at the National Archives:
https://catalog.archives.gov/search?q=%221940%20census%20enumeration%20district%20maps%22
For Steve’s Appalachian ancestors in Ashe County, NC, these maps show every holler and homestead. Steve wrote about overlaying ED maps onto modern street maps here:
The technique from yesterday’s blog post works the same way: extract the map data, generate a 3D rural scene (farmhouses, dirt roads, mountains), and overlay ghost labels with census data. Peak ED map artistry was 1940.